



A wave of fear has inundated stock markets, and most assets, including Bitcoin, have fallen as a result. Are we approaching the point where the market could rally into this fear?
US 10-year bond yield heading lower
Source: TradingView

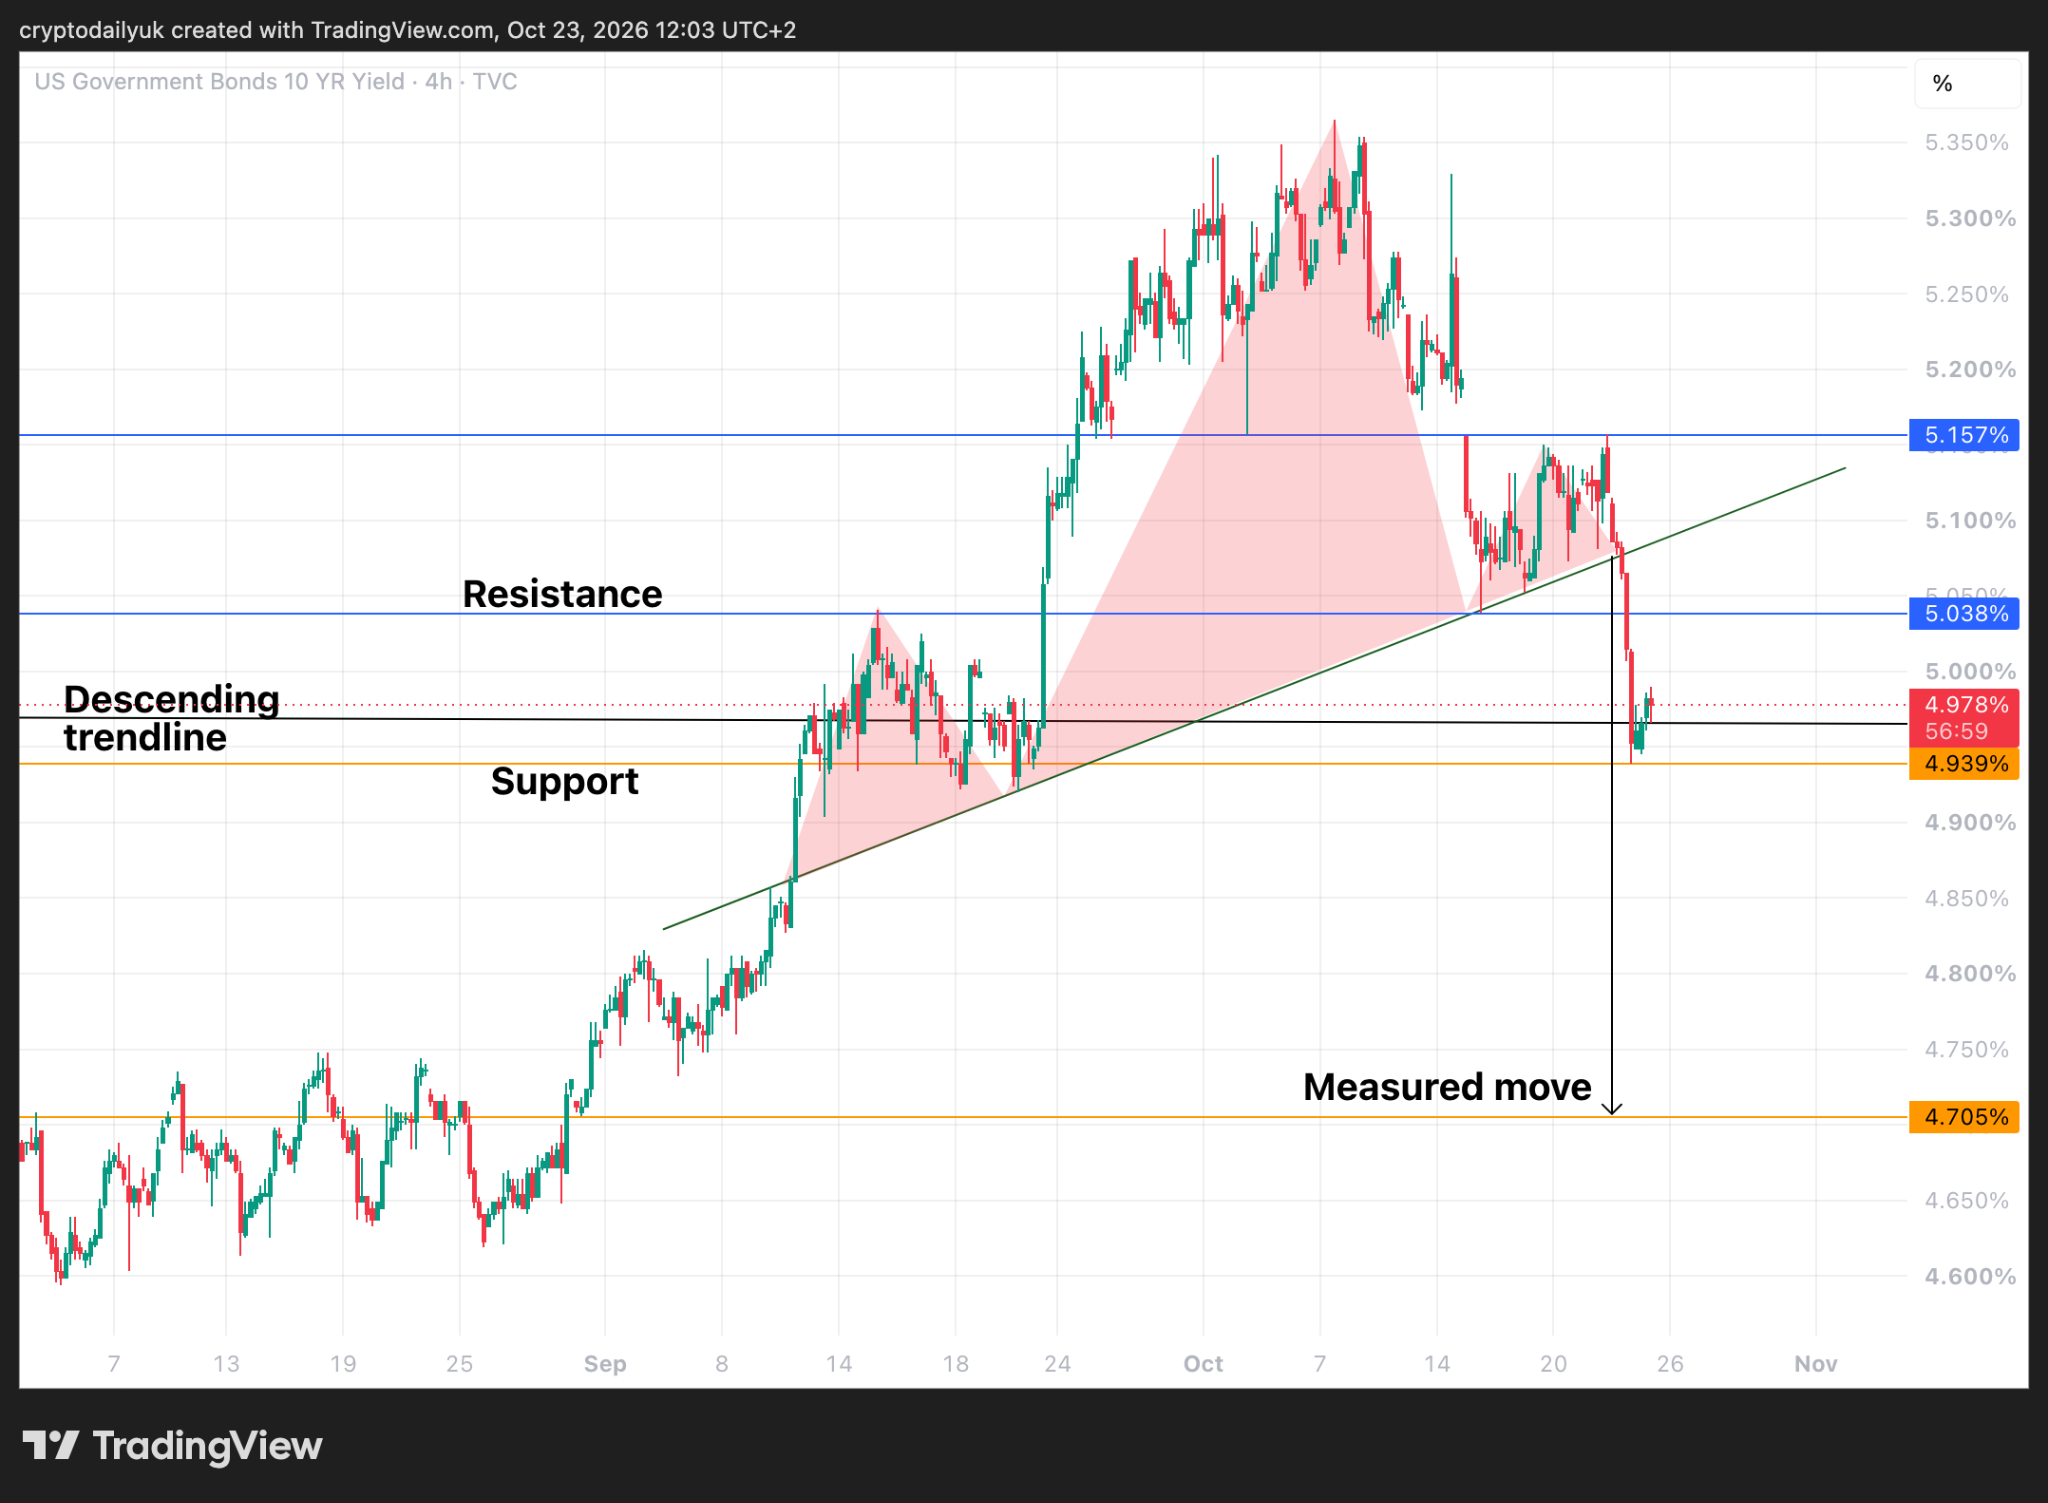
One hugely problematic factor in stock markets falling and most assets being unable to rise is bond yields. The U.S. 10-year government bond is the standard that markets look to, and this particular yield has risen mercilessly over previous weeks. However, it very much looks like the 10-year yield has made a top – at least into the short to medium term.
The short-term chart above shows that the yield has rolled over from its height of 5.36%. A head and shoulders pattern then broke to the downside, and it can be seen that the yield is potentially heading back to the measured move of 4.7%.
$BTC price back at the bottom of the channel – bounce or breakdown?
Source: TradingView
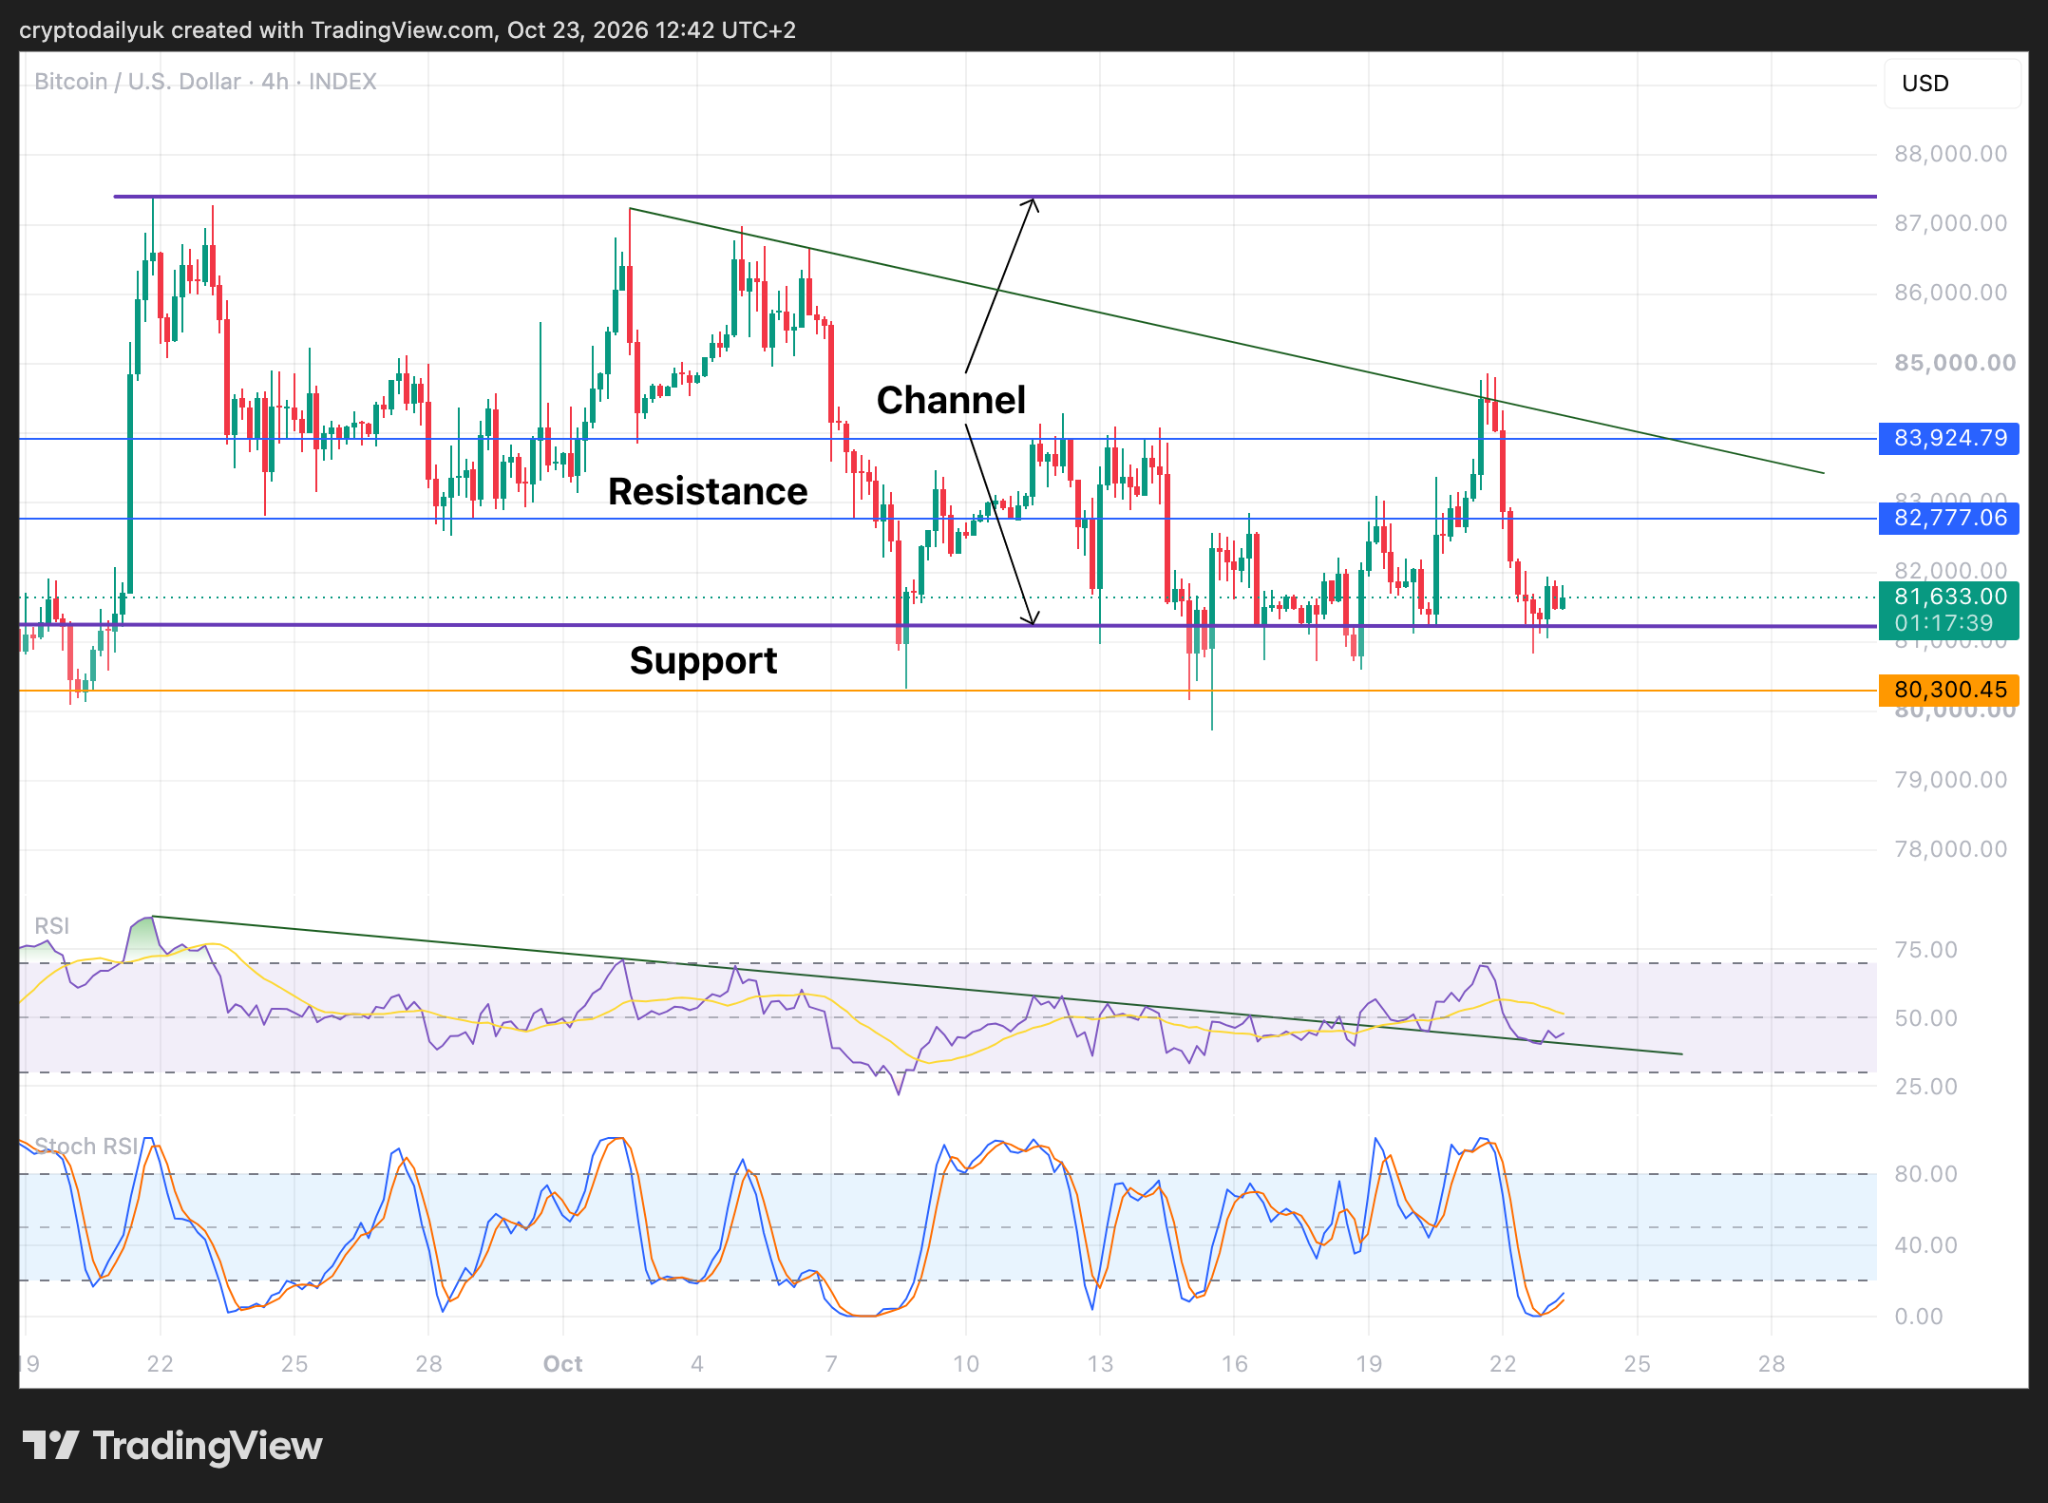
Into the Bitcoin chart it can be observed that the $BTC price is still holding on above the bottom of the parallel channel, and when all is said and done, the price has really just gone sideways for quite some time now.
In spite of the bearishness pervading the market, the $BTC price has a decent chance of rising up to the descending trendline and the $84K resistance level once again.
The Relative Strength Index reveals that the indicator line is still bouncing along the top of the descending trendline, while in the Stochastic RSI, the indicator lines have bounced from the bottom and may be about to signal some upside price momentum later today and into the weekend.
Possible confirmation below the 50-day SMA
Source: TradingView
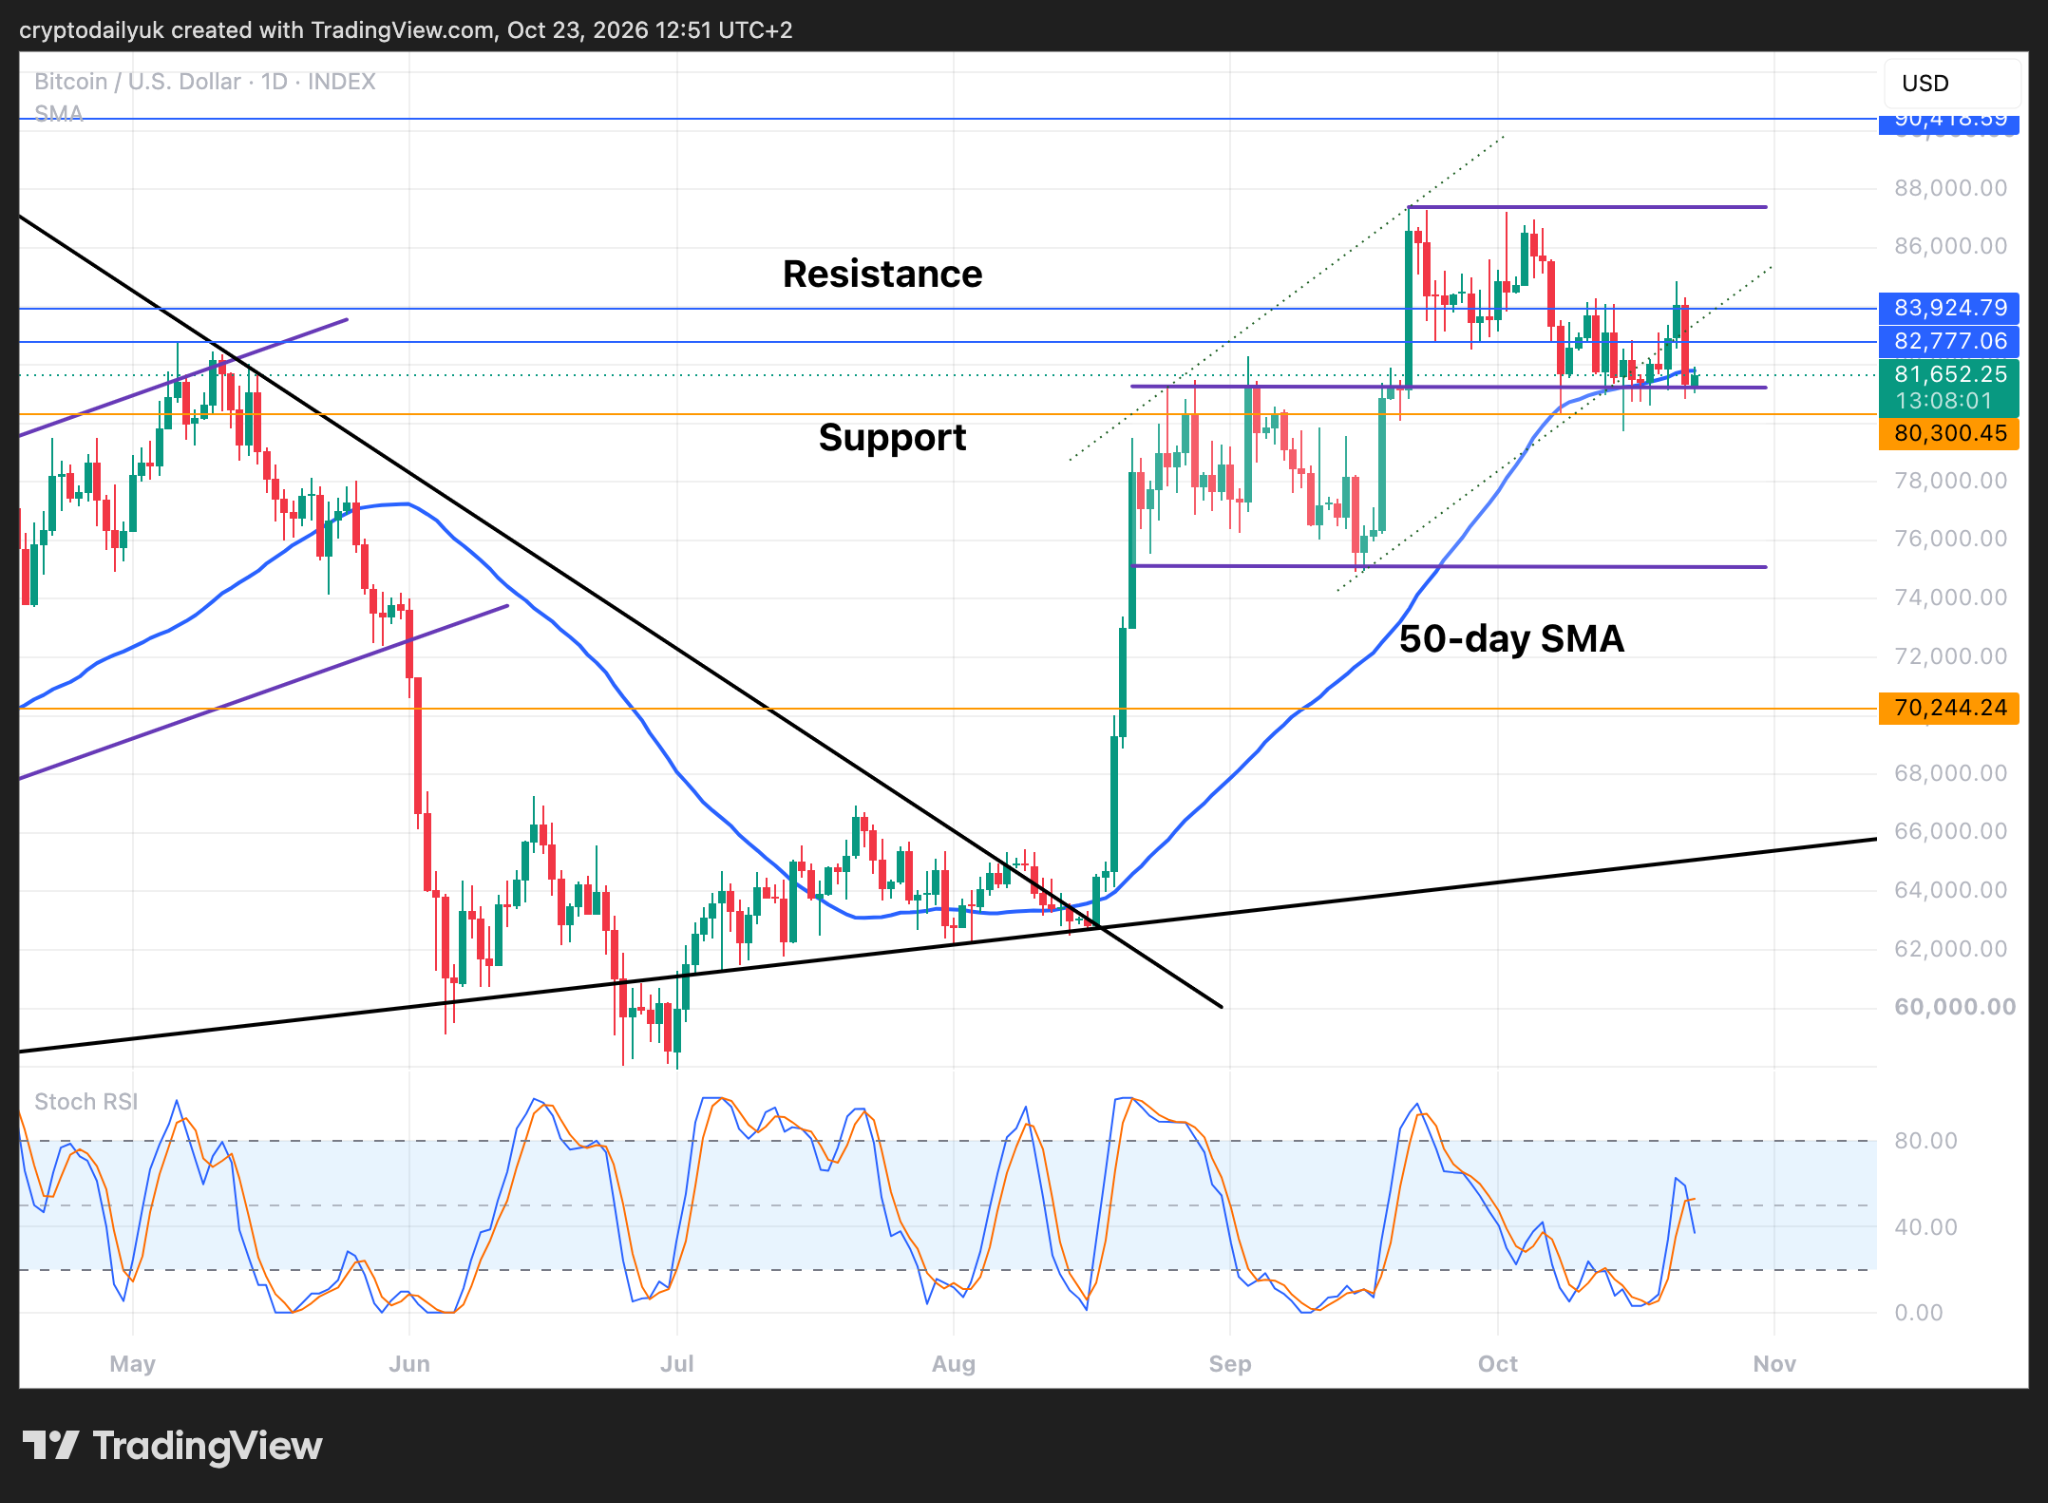
While the $BTC price is still holding the intersection between the two parallel channels, there are concerns emerging. The price looks as though it may be confirming below the ascending channel (faint dotted lines). That said, this channel might not be valid, given that it lacks three touches of the top trendline.
Another issue is that the $BTC price has fallen below the 50-day SMA. If this current daily candle closes below, that will be the confirmation of a breakdown.
Finally, the daily Stochastic RSI indicators have turned around. The red slow line is back on top of the blue fast line, meaning that upside price momentum is falling, and this in a higher time frame.
Precarious setup in the weekly time frame
Source: TradingView
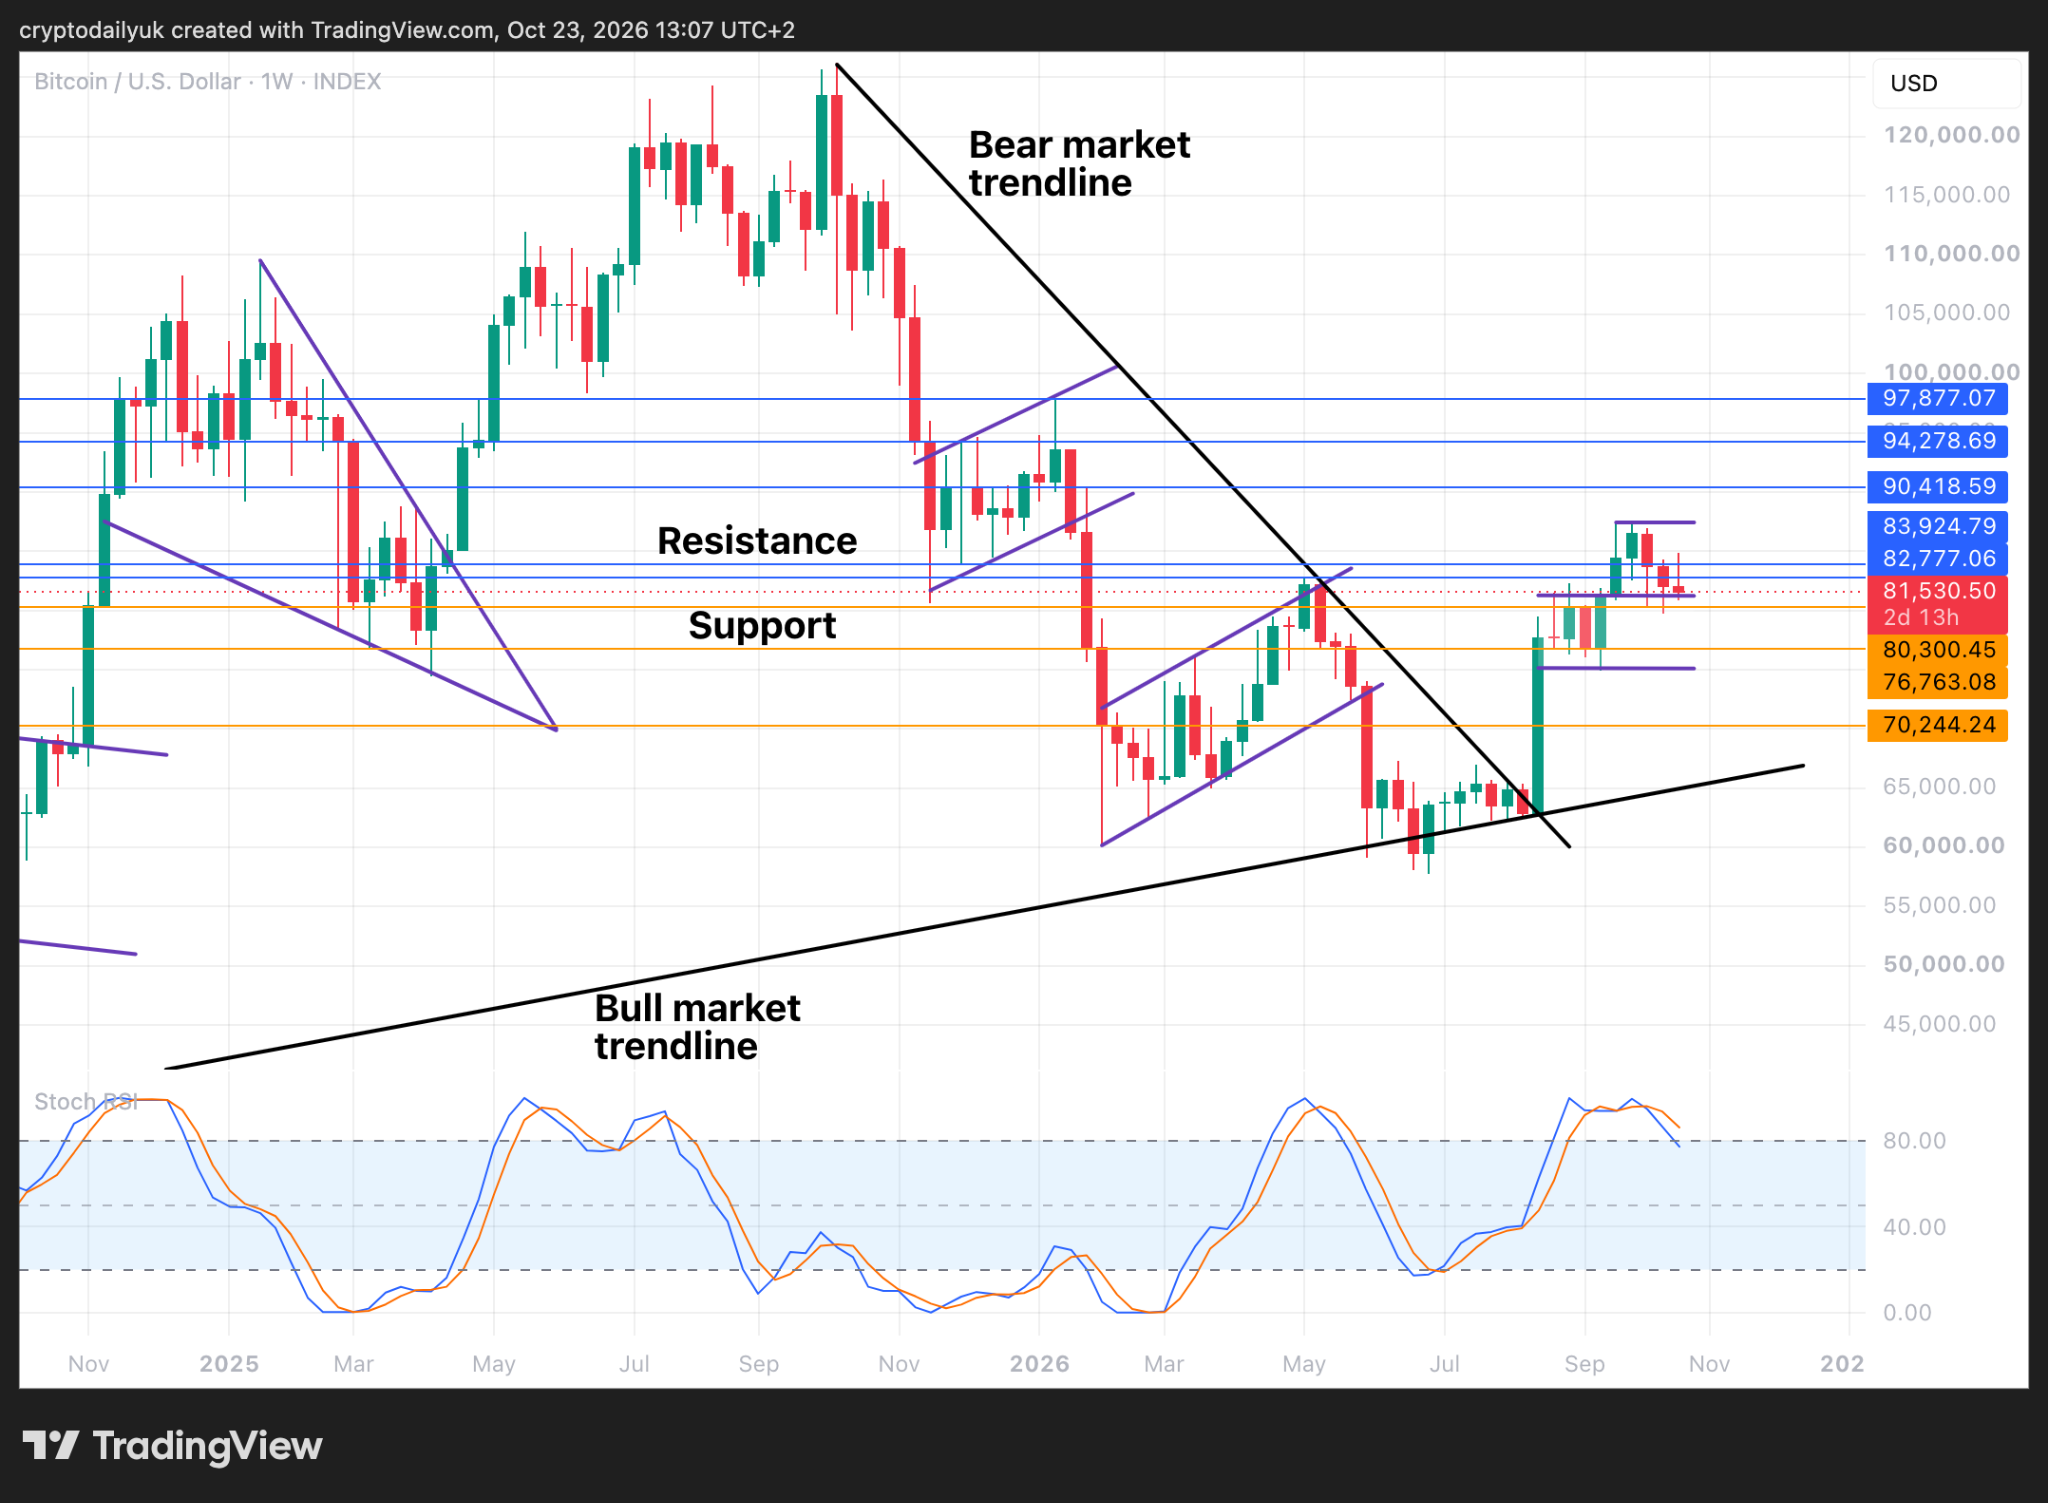
It’s still early on Friday, and the weekend is to come. Nevertheless, the setup in the weekly time frame is a precarious one. The $BTC price is at the very bottom of the upper parallel channel, and a hanging man candle is currently showing. This is bearish, so the bulls will need to push the price back up in order to avoid a bad signal for next week.
To cap it all, the Stochastic RSI indicators are coming back down. Both indicators could be below the critical 80.00 level going into next week. This would likely be the signal for a continuation of the correction, quite possibly back to the $70k region.
Finally, one more thing to think about. Markets are very bearish right now. The U.S. stock market is rolling over from its high at nearly 7,900 points. Currently at 7,683, strong support awaits below at 7,630. With so much negative sentiment in the market, could a relief bounce be on the horizon?
Disclaimer: This article is provided for informational purposes only. It is not offered or intended to be used as legal, tax, investment, financial, or other advice.





Be the first to comment