



Ethereum’s [ETH] deflationary edge over Bitcoin may be fading.
Since the merge, 55.4% of the newly issued ETH has been burned. However, this number has dropped significantly to only 2.7% over the last thirty days. In addition, ETH’s yearly supply growth has increased to 0.86%, which is almost Bitcoin’s 0.82%. That’s a sharp pullback in ETH burning, impacting its scarcity argument and potentially challenging the long-term bullish thesis versus BTC.
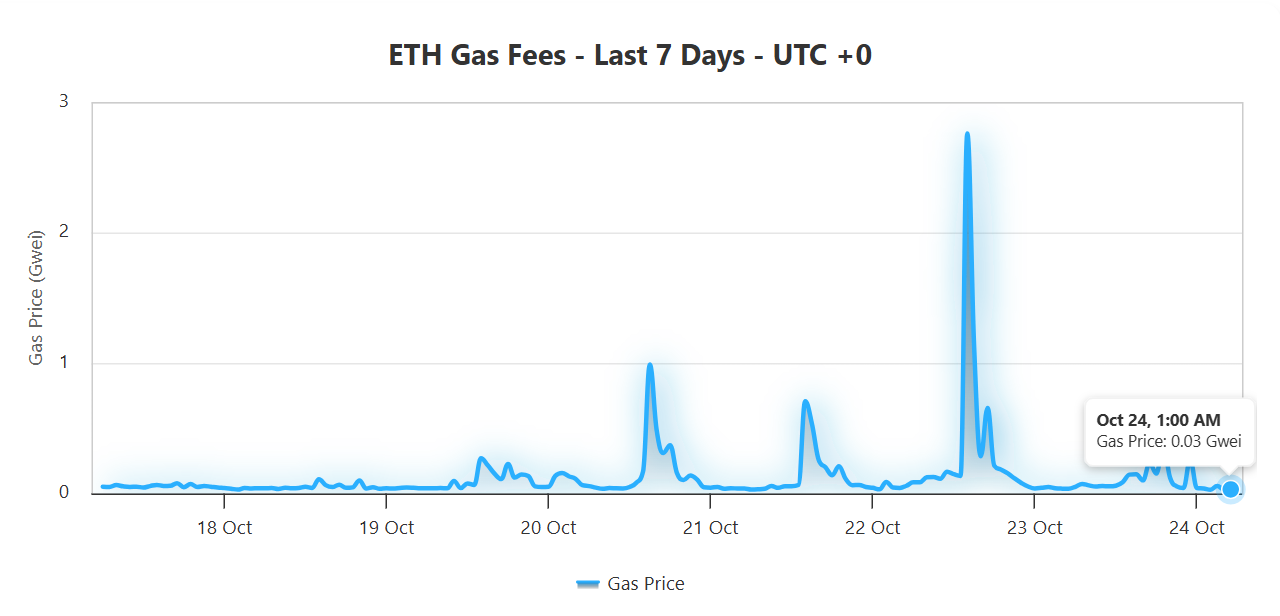
So, with ETH’s deflationary narrative being challenged, its next leg higher could increasingly rely on demand for Ethereum’s Layer 1 block space. As the chart below shows, gas prices have dropped from 2.76 Gwei to just 0.03 Gwei in two days, fueling the “Is ETH the new SOL?” debate. But cheaper prices are not always good, as they can also signal weaker demand for the block space.
Notably, this is where a key on-chain metric comes into play.

According to CryptoQuant data, Ethereum Velocity is at 11.03, implying that ETH is circulated actively on the blockchain. Moreover, the number of active addresses has hit 627k, suggesting growing adoption. And if the demand is sustained on a declining gas fee, the cost to transact on ETH will remain cheap despite active use.
In this context, declining gas fees could be a bullish sign, which brings ETH/BTC back to the forefront. While Ethereum’s deflationary edge is being eroded, strong Layer 1 activity could offset it. The important question is whether ongoing on-chain demand will catalyze a rebound in ETH/BTC. In turn, translate into a stronger relative performance against Bitcoin [BTC].
Ethereum’s bullish positioning raises hopes of BTC outperformance
The divergence between ETH’s technical and fundamental setup is growing interesting.
While the overall whale activity seems to be cooling, the Bitfinex whales’ ETH long positions are rising sharply, suggesting smart money is positioning for further upside. Meanwhile, ETH/BTC is also showing a pattern similar to its pre-altseason setup in 2021, forming higher highs and retesting its trendline.
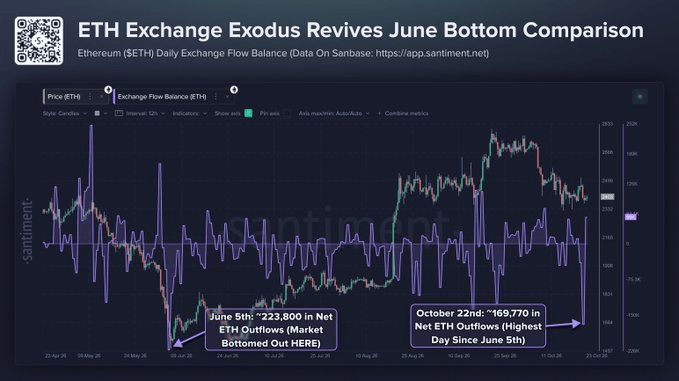
On-chain data adds another bullish sign. According to Santiment, about 169k ETH left exchanges on a net basis. This marked the largest daily outflow in more than four months. A similar development occurred on the 5th of June when roughly 223,800 ETH left exchanges as ETH reached its lowest price since the beginning of April 2025, only to climb rapidly in the following days.
Taken together, strong network activity, rising whale longs, and a significant ETH exchange outflow make up Ethereum’s bullish case. Should ETH/BTC follow the same pattern as it did in 2021 ahead of the altseason, another breakout could be on the way.
The logic is simple: While Ethereum’s advantage over Bitcoin in terms of deflationary properties has weakened, an increase in layer 1 demand, rising whale longs, and ongoing exchange outflows may create conditions for a supply squeeze. Taken together, these factors suggest ETH could be building momentum for a potential breakout against BTC once the market turns back to risk-on.
Final Summary
-
Rising Ethereum activity could support ETH’s recovery against BTC.
-
Whale longs and ETH outflows could help Ethereum outperform Bitcoin when market sentiment improves.



Be the first to comment