



Cardano has bounced near $0.20 after surrendering more than half of its measured rally, leaving buyers with a first recovery test at the moving-average cluster near $0.21.
ADA traded at $0.205 on October 26 at 16:20 UTC, up 0.69%, or $0.0014, on the Binance ADA/USDT daily chart. The session ranged from $0.2005 to $0.2082, with volume at 50.7 million ADA and the daily candle still open.
Key Takeaways
- ADA is approximately 27.1% below its October high.
- The decline remains inside a descending parallel channel.
- Price is below all three moving averages, leaving recovery unconfirmed.
The pullback could still form a base within the larger rally
Cardano advanced from around $0.137 to $0.28 before reversing into the blue descending channel. The retreat has produced lower highs and lower lows, while the latest candle shows an initial response near the psychological $0.20 mark.
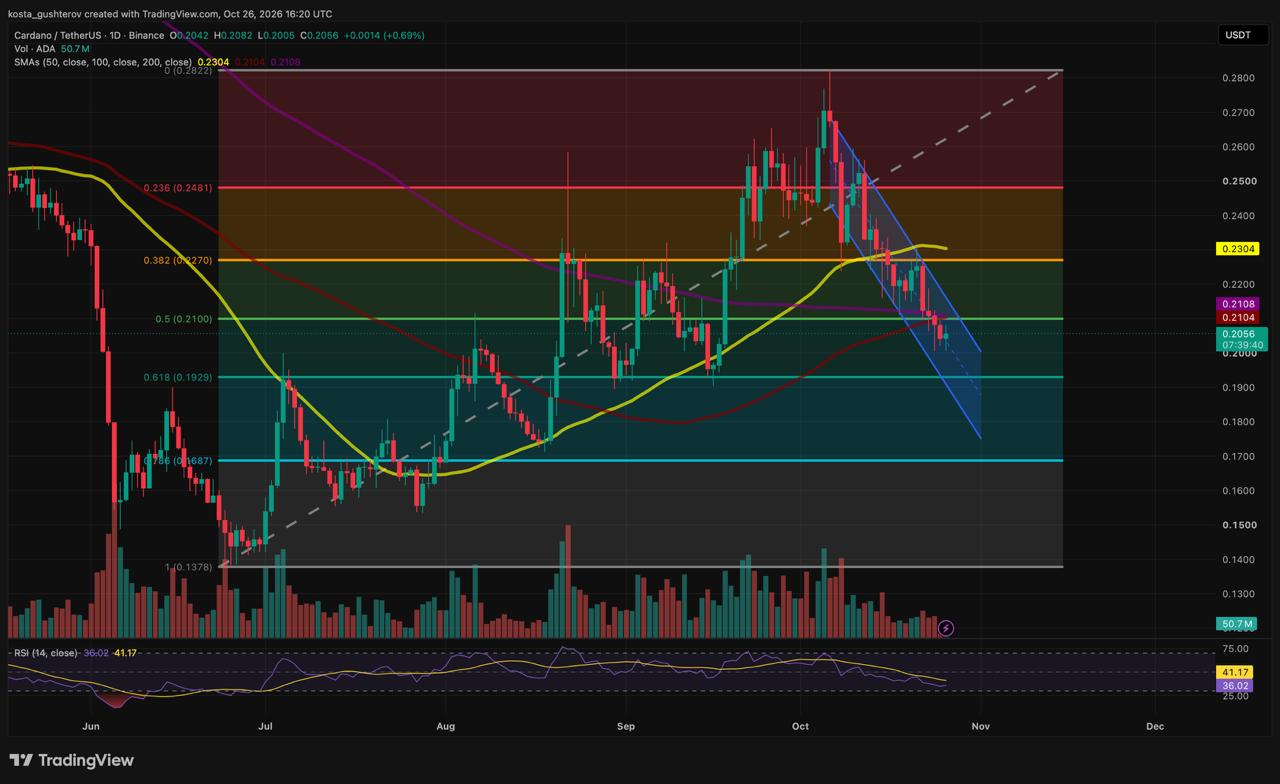
If buyers defend this area and the lower channel boundary holds, the decline could develop into a base for another attempt higher within the broader advance. The recovery case rests on that support surviving long enough for ADA to stop making lower highs and regain lost levels.
The lower-high sequence remains intact, so another advance depends on buyers changing that price structure rather than producing a single positive candle.
Momentum still favors the recent decline. Daily relative strength index, or RSI, stood at 36.02, below its neutral midpoint of 50 and smoothing line at 41.17. It remains above the conventional oversold threshold of 30, and its current reading offers no confirmation that sellers are exhausted.
Recovering $0.21 would be the first repair
The 50% Fibonacci retracement is $0.2100, just below the 100-day simple moving average at $0.2104 and the 200-day SMA at $0.2108. ADA is already below this band, so it is an area to reclaim rather than support buyers are currently defending.
A daily close above the cluster, followed by a pullback that holds it, would put those lost references beneath price again. The session’s high remained short of the band, so the latest bounce has not yet tested that recovery condition.
Buyers would also need to break the channel’s upper boundary to leave the recent descending pattern. Both channel lines move lower over time, making their positions different from the fixed horizontal Fibonacci levels.
Reclaiming the longer-term averages would still leave the 50-day SMA overhead. The next recovery sequence runs through the 38.2% retracement at $0.2270 and then that average at $0.2304, whose curve has begun turning lower. This allows for an initial recovery without assuming the entire downtrend has already reversed.
Above those nearer hurdles, the 23.6% retracement close to $0.248 is the next higher reference ahead of the previous peak.
A loss of $0.20 would put the correction under more pressure
A daily close below the round number, followed by a failed attempt to regain it, would weaken the current support reaction. The next Fibonacci reference is the 61.8% retracement near $0.193.
The channel’s lower boundary lies below the round number, so losing horizontal support and breaking the channel would be separate developments. A sustained move beneath that boundary would show the decline extending outside its recent path and undermine the case for a base around the current area.
If the 61.8% level also gives way, the 78.6% retracement at $0.1687 becomes the next downside reference. A return to the original low would erase the full measured advance, but it would require ADA to lose the intervening levels first.
This article is provided for informational purposes only and does not constitute financial or investment advice. Technical indicators and chart levels are interpretive tools, not guarantees of future price movement.

Kosta has reported on cryptocurrency markets and blockchain infrastructure since 2020, bringing over six years of hands-on experience in the crypto industry built through daily tracking of markets, trends, and emerging blockchain developments. Specializing in Bitcoin on-chain analysis, institutional ETF flows, and digital asset price action, his work at Coindoo has been cited by other news agencies and consistently covers market developments with a focus on data-driven reporting across Bitcoin, Ethereum, Solana, and XRP.
Over the years, Kosta has contributed to multiple crypto media outlets in different regions, authoring over 6,000 articles across the sector. His reporting spans cryptocurrency markets and the broader fintech industry, tracking not only price action but also the technological and regulatory forces shaping the ecosystem.
To support his analysis, Kosta actively leverages on-chain data and metrics from leading platforms such as Santiment, Glassnode, and CryptoQuant, enabling deeper, evidence-based market insights. He believes in the power of transparency and the data that underpins the blockchain ecosystem.
His academic background in Marketing Management from Denmark further complements his analytical approach, adding a strong understanding of communication strategy and content positioning to his work.


Be the first to comment