



Sei price is gaining attention as the network expands its involvement in institutional tokenization and real-world asset (RWA) markets, yet its price chart indicates that bullish momentum has yet to materialize.
With major financial institutions ramping up their tokenization efforts on Sei, traders are monitoring whether this ecosystem growth can turn into a lasting recovery for SEI.
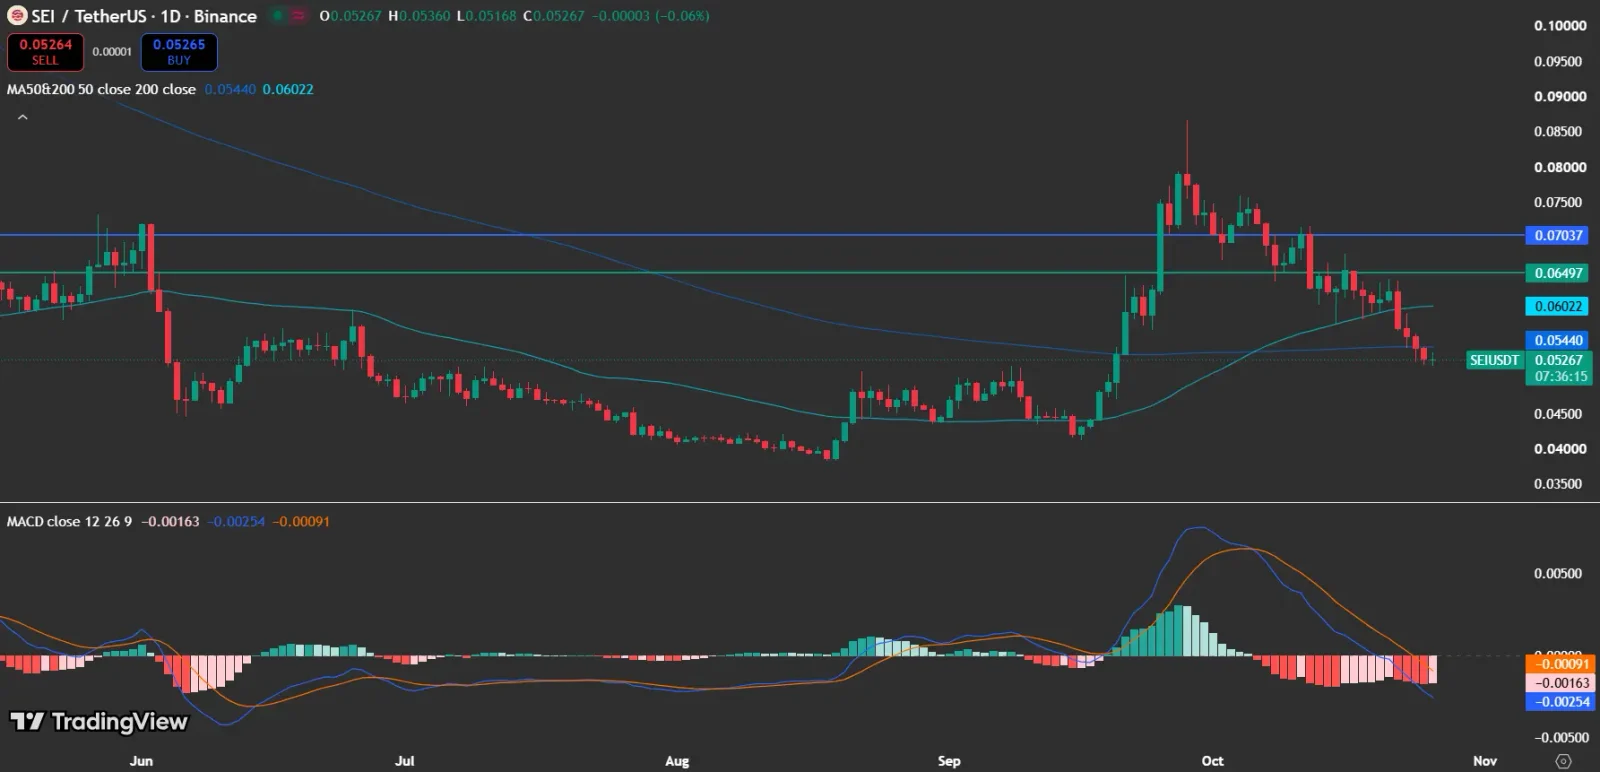
At the time of writing, Sei price is trading at $0.05267, down 0.06% over the past 24 hours, per the TradingView chart provided.
The token is still trading under both its 50-day and 200-day moving averages, which implies that sellers remain in control even as the network’s institutional footprint expands.

Also Read: SEI Price Eyes $0.06 Recovery as Giga Upgrade Advances
What Does Sei’s Latest X Update Reveal?
In a recent post, the official Sei Network account spotlighted Ondo, Securitize, Hamilton Lane, Brevan Howard, and KAIO, declaring that “Tokenization runs on Sei.” The post underscores the network’s commitment to moving traditional financial assets onto blockchain infrastructure.
The post also states, “Sei is the blockchain for trading.” These names span various segments of the tokenization ecosystem, ranging from asset issuance to investment management and infrastructure.
Earlier official announcements from Sei have outlined integrations involving Ondo’s tokenized Treasury product along with institutional funds distributed via KAIO and Securitize.
This development reinforces Sei’s institutional adoption narrative, though on its own it does not confirm rising demand for SEI tokens. Traders will have to weigh price action and network activity to judge whether the wider adoption story is shaping market sentiment.
Why Is Sei Price Under Bearish Pressure?
According to the TradingView chart, SEI is trading below its 50-day moving average of $0.06022 and its 200-day moving average of $0.05440. Both levels now serve as potential resistance, and the price sitting beneath them signals that the broader technical structure is still weak.
The MACD indicator likewise points to bearish momentum. The MACD line stands at approximately -0.00254, below the signal line at -0.00091, while the histogram reads -0.00163. This negative reading reinforces the ongoing downward pressure and suggests that bullish momentum has not yet returned.
Also Read: SEI Price Targets Significant Growth as Saphyre Introduces Stock Perpetuals
Can Sei Price Recover Above Key Resistance?
The $0.05440 200-day moving average is the first key level to watch for any potential recovery. A sustained break above it could lift short-term sentiment, but SEI would still need to reclaim the $0.06022 50-day moving average to challenge the broader bearish structure.
Additional resistance emerges near $0.06497, with $0.07037 beyond that. If buying pressure picks up, these levels may come into play, though the current chart has yet to confirm a bullish reversal.
To the downside, the current daily candle’s low of $0.05168 serves as an immediate reference point. A decisive break below this level could leave SEI open to further losses, with the $0.045 area acting as a broader historical support reference on the chart.
What Does CoinGlass Data Reveal About Sei Price?
CoinGlass‘s open-interest chart reveals that SEI derivatives positioning grew sharply during September before tapering off through October. Open interest has lately declined alongside the token’s price, pointing to reduced exposure in the derivatives market.
The liquidation chart likewise shows sporadic spikes in liquidations, including during the September rally and the volatility that followed. Such movements add context to market positioning, yet they do not determine where SEI will move next.
Also Read: Sei Tokenized Asset Growth Accelerates as SEI Price Outlook Gains Attention
Will Institutional Adoption Push Sei Price Higher?
Sei’s growing tokenization ecosystem provides a longer-term adoption story, even as its technical indicators currently signal continued weakness. A rebound above the key moving averages would offer stronger evidence that market sentiment is turning more positive.
Until that happens, traders will be watching to see whether institutional developments align with renewed buying pressure and firmer price action. Cryptocurrency markets remain highly volatile, so traders should track price action, market sentiment, and upcoming catalysts before making investment decisions.
Also Read: SEI Price Outlook Turns Bullish as Sei Network Announces New Development
This article contains market analysis and price predictions. These are not guarantees. Crypto markets are volatile. Always DYOR. Not financial advice.



Be the first to comment