


What to know:
- Gold drops below $4,600 as intense selling pressure grips global markets.
- More than $1 trillion was wiped from the total gold market value rapidly.
- Donald Trump’s Iran stance triggered an oil surge and gold price volatility.
- The market now watches key support and resistance levels closely.

Gold prices have sharply dropped below $4,600 on April 2, 2026, signaling a major shift in market sentiment. The sudden decline reflects intense selling pressure, likely driven by profit-taking, shifting macroeconomic expectations, or stronger currency movements impacting safe-haven demand.
The crash has wiped out over $1 trillion from the asset’s total market value in a single day, marking one of the most significant declines in recent history.
Such a steep drop could trigger volatility ahead, as investors reassess positions and watch for potential stabilization or further downside.

Also Read: XRP Enters $14T Gold Market in Bold Move
What Triggered the Gold Price Crash?
Trump’s reaffirmation of continued U.S. attacks on Iran triggered a sharp fall in gold prices on Thursday, as oil prices rose in response to growing geopolitical tensions.
This led to a rise in crude oil prices by almost 7%, which in turn triggered a fall in gold prices. The rise in inflation worries boosted the dollar and increased yields for the United States, which made gold less attractive due to its non-yielding nature.
During this period, there were changes in the expectations of the Federal Reserve, which reduced expectations for rate cuts and increased the fall in gold prices.
Technical Structure Signals Transition Phase
From a technical perspective, gold is nestled within the Ichimoku cloud. This position suggests a form of hesitation and a fuzzy trend, as if the markets are slowly pulling out of a strong uptrend and into a corrective heartbeat. In the near term, there has been a loss of momentum.
Moving averages are curling down, which is dampening the glow of bullish vigor. However, the price is still holding within the support range of 4,450-4,550. This range is still key for short-term direction. A fall below this range can speed up the fall.
The first resistance area will be in the range of $4,631 to $4,645. However, the next resistance area will be slightly tougher, in the range of $4,690 to $4,700. After that, the main supply area will be in the range of $4,836 to $4,938.
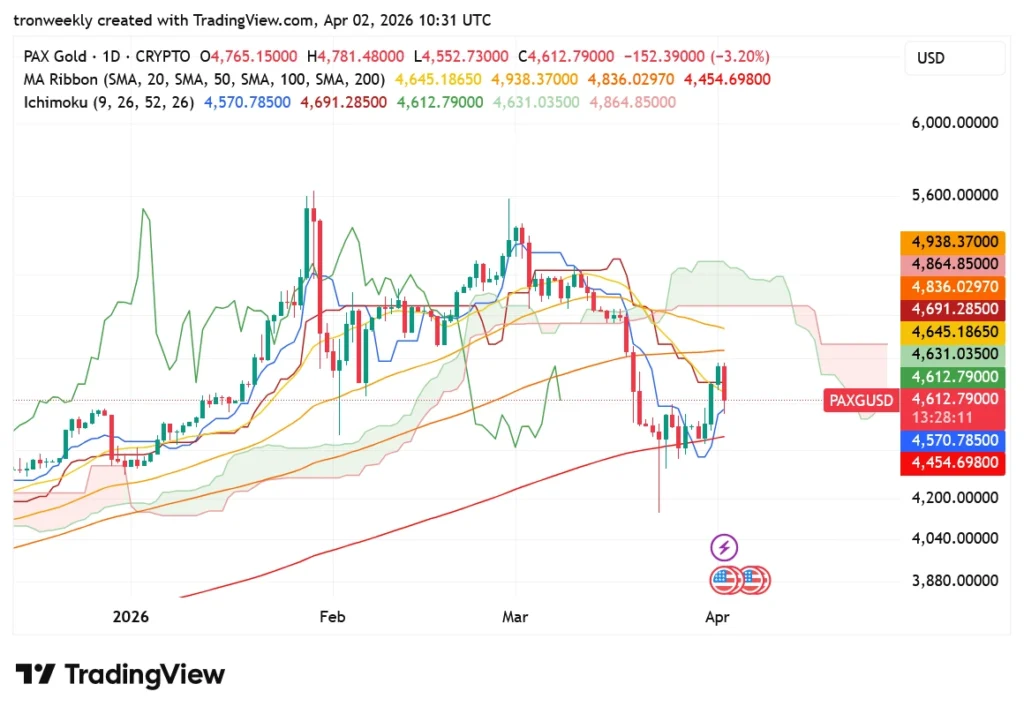
On the flipside, significant supports lie at levels of $4,570-$4,550 and at $4,454. In case the price declines even further, it could fall and test the levels of $4,200.
As long as the price is below $4,700, sellers will have control. In case there is a pullback at this resistance, it will add to the bearish momentum.
A move above $4,700 will shift the sentiment to a bullish bias. This will open the door to further upside to $4,836 and then to $4,938. Failure to support the price above $4,550 will increase the risks. Otherwise, the price will likely range.
This article contains market analysis and price predictions. These are not guarantees. Crypto markets are volatile. Always DYOR. Not financial advice.
Also Read: Gold Falls 17% as Binance Futures Volume Hits $17B

Be the first to comment