


What to know:
- Tron Inc. bought 158,409 TRX at $0.3156, boosting its long-term crypto treasury strategy.
- RSI at 57.31 and bullish MACD crossover point to steady upward momentum.
- A break above $0.32 could open a path toward the $0.40 resistance zone.

Tron Inc. (NASDAQ: TRON) has expanded its digital asset strategy by purchasing 158,409 TRX tokens on Thursday, April 2, at an average price of $0.3156.
The acquisition increases its confidence-driven accumulation approach and reinforces its commitment to building a strong blockchain treasury position aligned with long-term value creation across the Tron ecosystem and broader crypto market outlook.

Source: TRONSCAN

With this latest buy, Tron Inc.’s TRX holdings now exceed 689.6 million tokens, highlighting its continued focus on treasury expansion.
The company views its digital asset strategy as a long-term balance sheet enhancement, aiming to strengthen shareholder value through sustained accumulation and deeper integration into the Tron blockchain network’s evolving financial ecosystem.
Also Read: TRON (TRX) Eyes $2+ Rally Following Strong Institutional Accumulation
TRX Technicals Reveal Ongoing Bullish Trajectory
Following the institutional acquisition, TRX has demonstrated a consistent bullish trend over the past few weeks. The asset currently trades at $0.31597.
According to TradingView, the asset has significant support from the 20-week EMA at $0.29895. The asset has been trading in a tightening range. The asset has been trading in this range below the recent high.
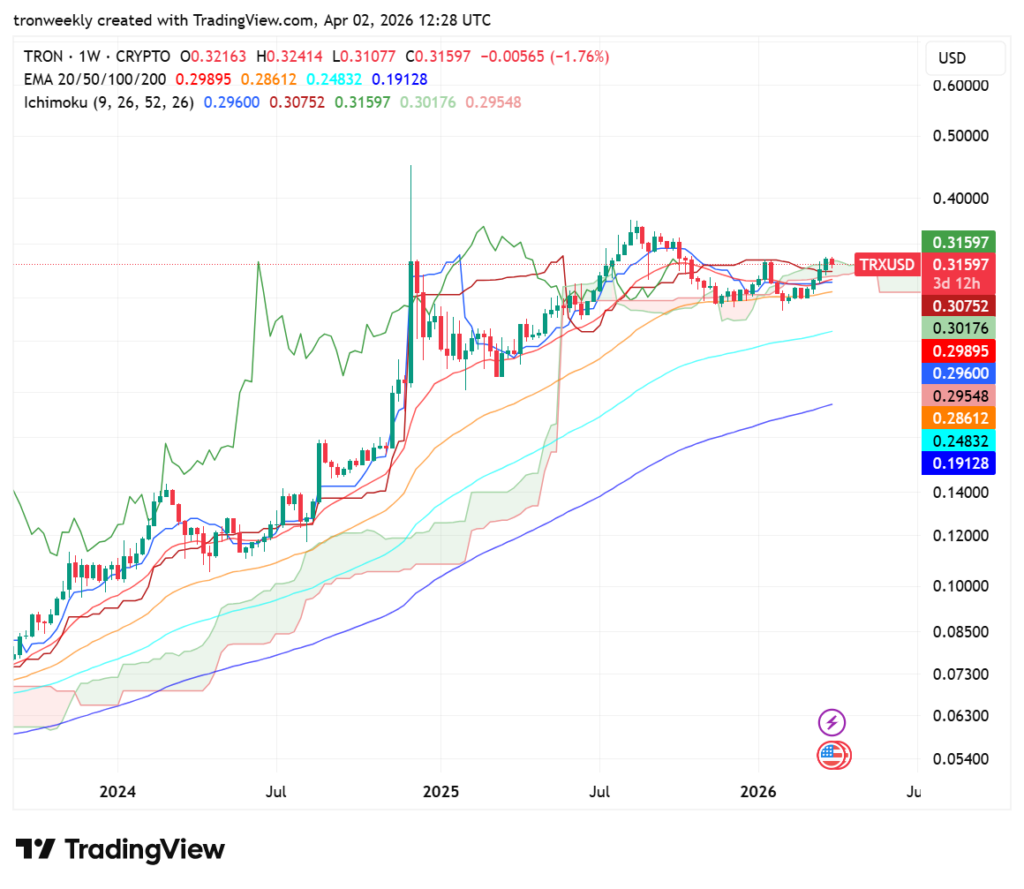
Source: TradingView
The Ichimoku Cloud also confirms the positive outlook as the price is well above the green cloud. The Tenkan-sen and Kijun-sen lines are crossing, which is an indication of low volatility before a major movement.
Although there is a possibility of a drop to $0.24832, if it can break through $0.32, it can reach its target at $0.40.
Momentum Indicators Support the Recovery Phase
The Relative Strength Index (RSI), which is currently at 57.31, is in a neutral to bullish position since it is above the midpoint. The position of the current RSI suggests that the momentum is stable.
The history of the market shows that the price of TRX changes significantly when the RSI moves up. The current position of the RSI is in consolidation.
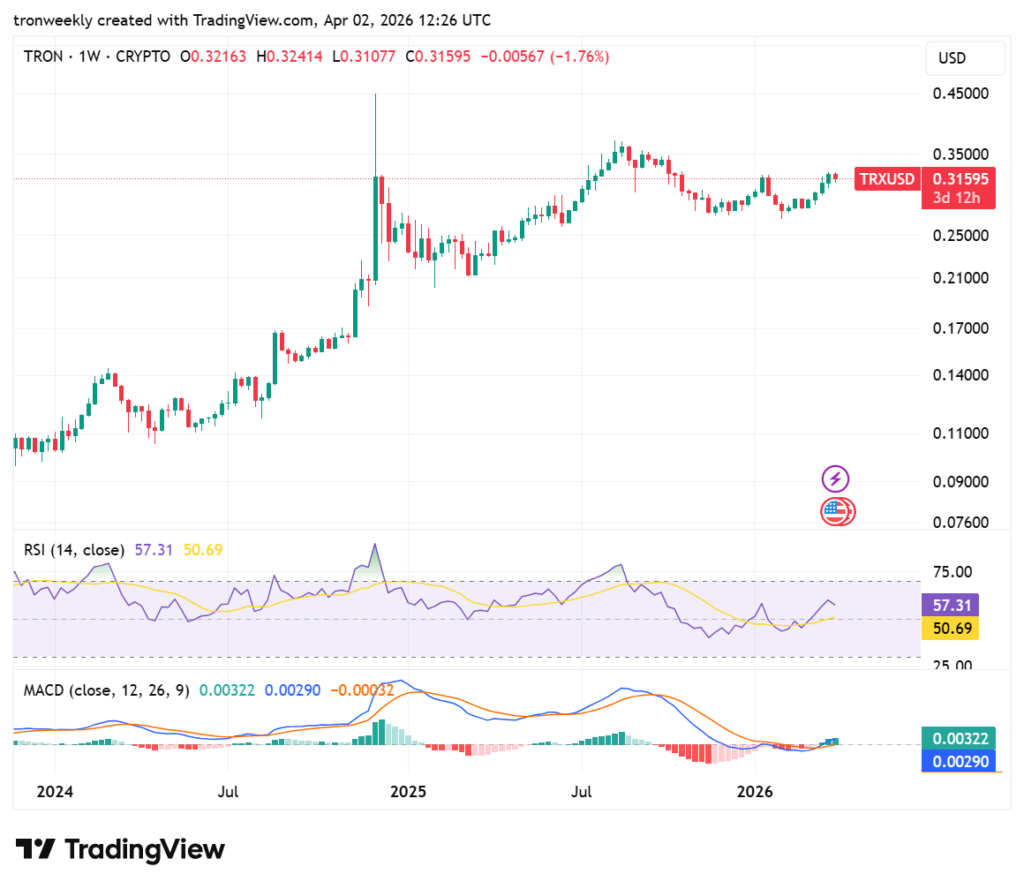
Source: TradingView
The MACD indicator reflects a positive move as the blue line moves above the orange line. This move has been confirmed by the histogram turning green, indicating a move away from the downward trend.
While the momentum continues to build up, the close proximity of the lines suggests that the move will require more volume to sustain the trend.
This article contains market analysis and price predictions. These are not guarantees. Crypto markets are volatile. Always DYOR. Not financial advice.
Also Read: Tron Inc. Expands Treasury to 689 Million Tokens, TRX Eyes $0.48 Target

Be the first to comment