


What to know:
- Kraken listed OKB, expanding global exposure and improving liquidity for the XLayer ecosystem built on the OP Stack.
- OKB continues to move in a bearish structure, remaining below the 200-day EMA near $100.60 despite recent listing momentum.
- The RSI near 40 and a bearish MACD crossover suggest weakening momentum and sustained downside pressure.

Crypto exchange Kraken has officially listed OKB, expanding access to the token across global markets. OKB is the native gas asset of XLayerOfficial, a Layer 2 blockchain built on the OP Stack.
It powers transactions, smart contracts, and ecosystem activity, strengthening connectivity between users, developers, and decentralized applications within scalable infrastructure, boosting liquidity and adoption.
Source: Kraken Listings’ X Post

The listing on Kraken is expected to enhance liquidity and global visibility for OKB across institutional and retail markets.
XLayerOfficial continues positioning itself as a scalable Layer 2 network leveraging OP Stack architecture to support faster transactions, lower costs, and decentralized application adoption, reflecting the growing importance of modular blockchain infrastructure in the crypto market.
Also Read: OKB Rebounds Strongly From 20-Day EMA: Is a Explosive Bullish Breakout Next?
OKB Technical Indicators Reveal Bearish Outlook
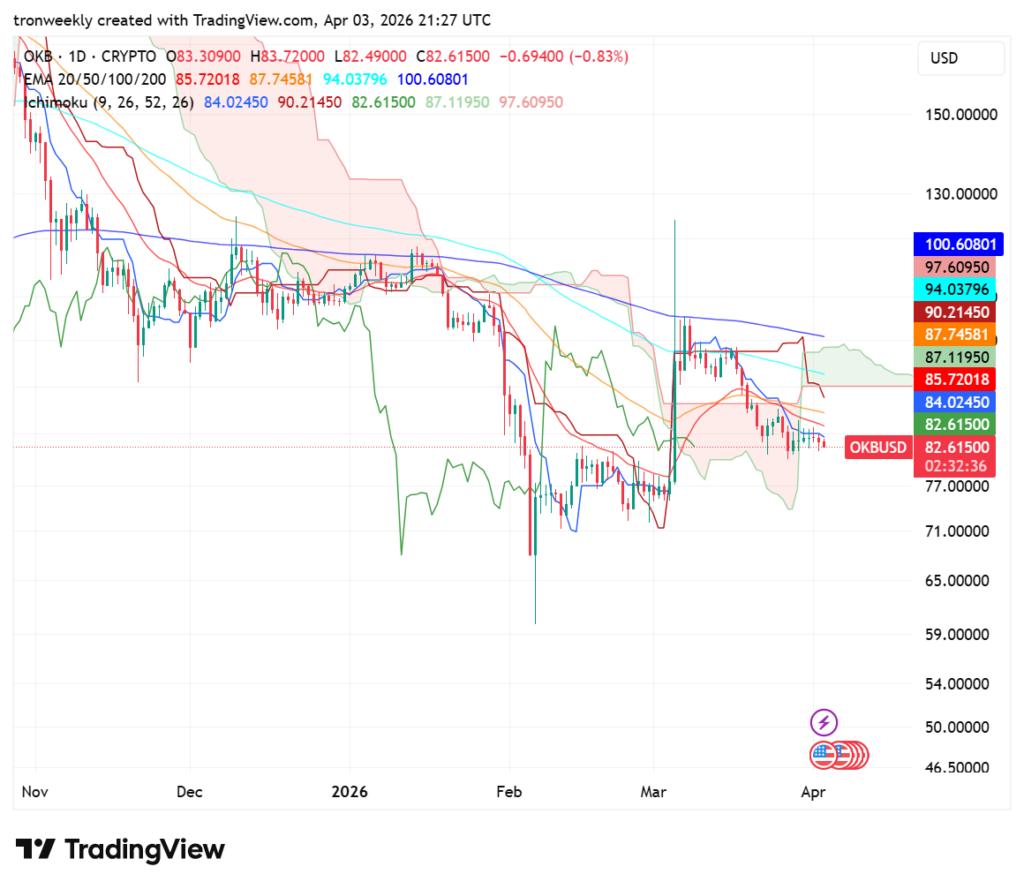
Despite the listing on Kraken, OKB shows a clear bearish trend, with the price currently trading at $82.61. According to TradingView, it remains pinned below major exponential moving averages, specifically the 200-day EMA at $100.60.
After failing to sustain a recovery above $90 in March, the asset is drifting downward, signaling that sellers maintain dominance over the prevailing market sentiment.
Source: TradingView
Ichimoku Cloud also confirms the pessimistic forecast. The asset’s price trades under the cloud, whereas the red-colored cloud coming forward implies strong future resistance.
Even with a short-term increase in February, the absence of momentum suggests that the support at $77 could be tested again. The breakout above $87 will be needed to change the existing bearish technical picture.
Momentum Indicators Support Downward Pressure
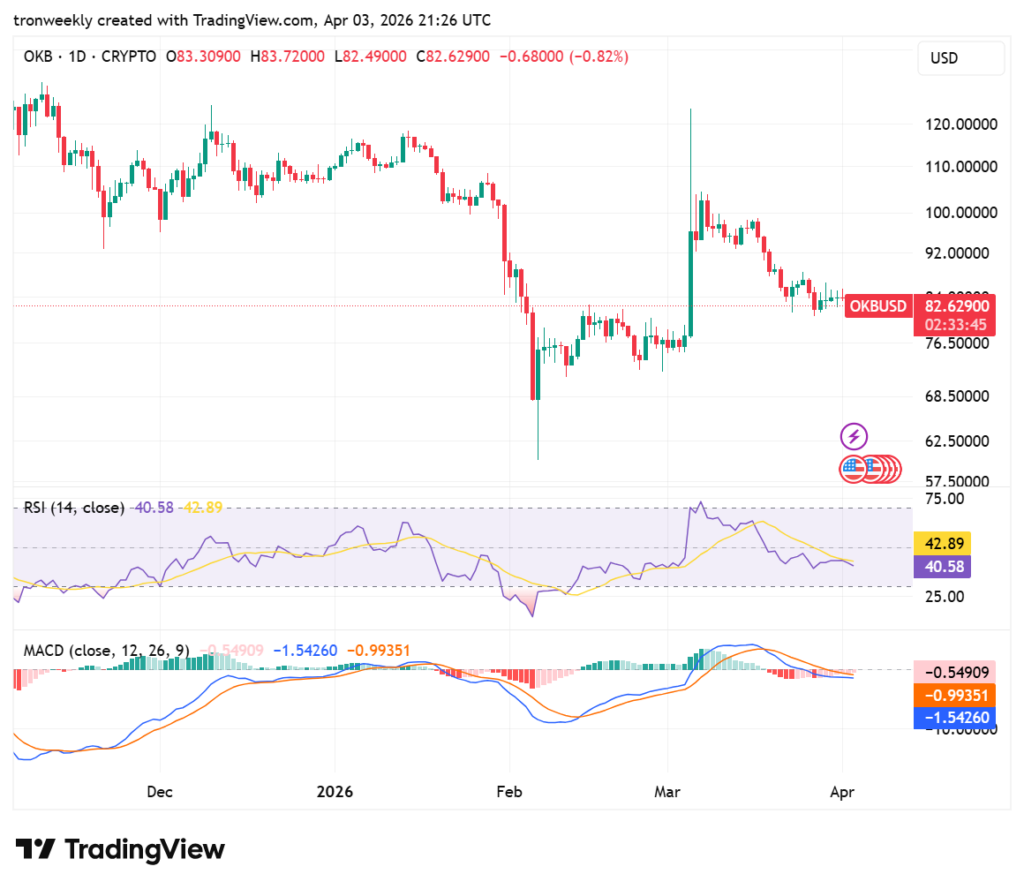
The RSI is presently trading around the 40.58 level, which represents a range of neutrality to bearishness.
The indicator is below its trigger level of 42.89, implying that there has been a halt in upward momentum as the security experiences pressure in the opposite direction. The fact that the RSI is above the 30 level means it is not oversold.
Source: TradingView
This cautious technical picture has been confirmed by the MACD, which has been bearish since the end of March. The blue MACD line crossed under the orange signal line, and the histogram moved to the negative territory.
These conditions are considered to be bearish in the short term. That is why, until the convergence process begins, the bias is still bearish.
This article contains market analysis and price predictions. These are not guarantees. Crypto markets are volatile. Always DYOR. Not financial advice.
Also Read: OKB Price Surges 36% After NYSE Parent ICE Invests in OKX
Be the first to comment