


What to know:
- TRON Inc. purchases 159,004 TRX, boosting total holdings above 689.9M tokens.
- TRX remains strongly bullish, holding above key EMAs and trading near the $0.317 level.
- Momentum indicators improve as MACD nears a bullish crossover and RSI stays mid-range.

TRON Inc. (NASDAQ: TRON) has expanded its digital asset treasury with the purchase of 159,004 TRX tokens, at an average price of $0.3145.
This latest acquisition increases its total holdings to over 689.9 million TRX, reinforcing a steadily growing accumulation strategy aimed at strengthening its balance sheet through exposure to TRON ecosystem assets.

Source: TRONSCAN

The company’s continued TRX purchases reflect a long-term treasury approach focused on enhancing shareholder value through blockchain-based reserves.
By steadily increasing its holdings, TRON Inc. signals confidence in TRX adoption and ecosystem growth, positioning its digital asset strategy as a core component of future financial positioning and broader participation in decentralized network expansion trends.
Also Read: Tron Inc. Expands Treasury to 689 Million Tokens, TRX Eyes $0.48 Target
TRX Technical Outlook Reveals Strong Upward Potential
Following this major acquisition, TRX exhibits a strong bullish trajectory, trading at $0.317. The price consistently holds above the 20, 50, 100, and 200 EMAs, confirming a sustained uptrend.
After retreating from a $0.325 peak, the asset found reliable support near the median Bollinger Band, indicating that buyers remain active during these minor price consolidations.
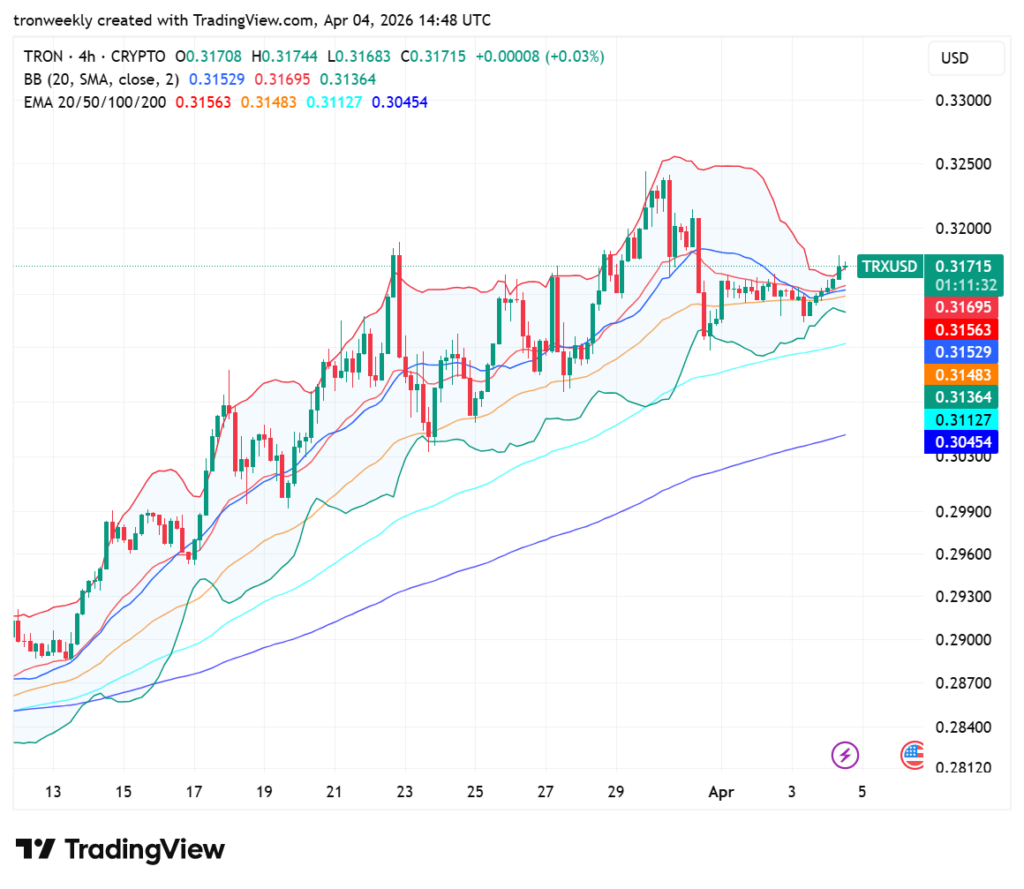
Source: TradingView
However, at the moment, the Bollinger Bands are tightening, indicating that there is a volatility squeeze before the next big move.
While the price is testing the 20 EMA resistance, the double bottom pattern underpinning the candlestick chart serves as an effective buffer against any downward movement. However, the price must first break above $0.320 to confirm a move higher.
Momentum Indicators Support the Recovery Phase
MACD signals that there is a phase of slowing momentum following the late-March rally, where the signal line moved above the MACD line.
But in the most recent 4-hour candles, the MACD line is now forming a positive curl before crossing over into bullish territory. The histogram is now colored green, indicating that the selling pressure is starting to fade.
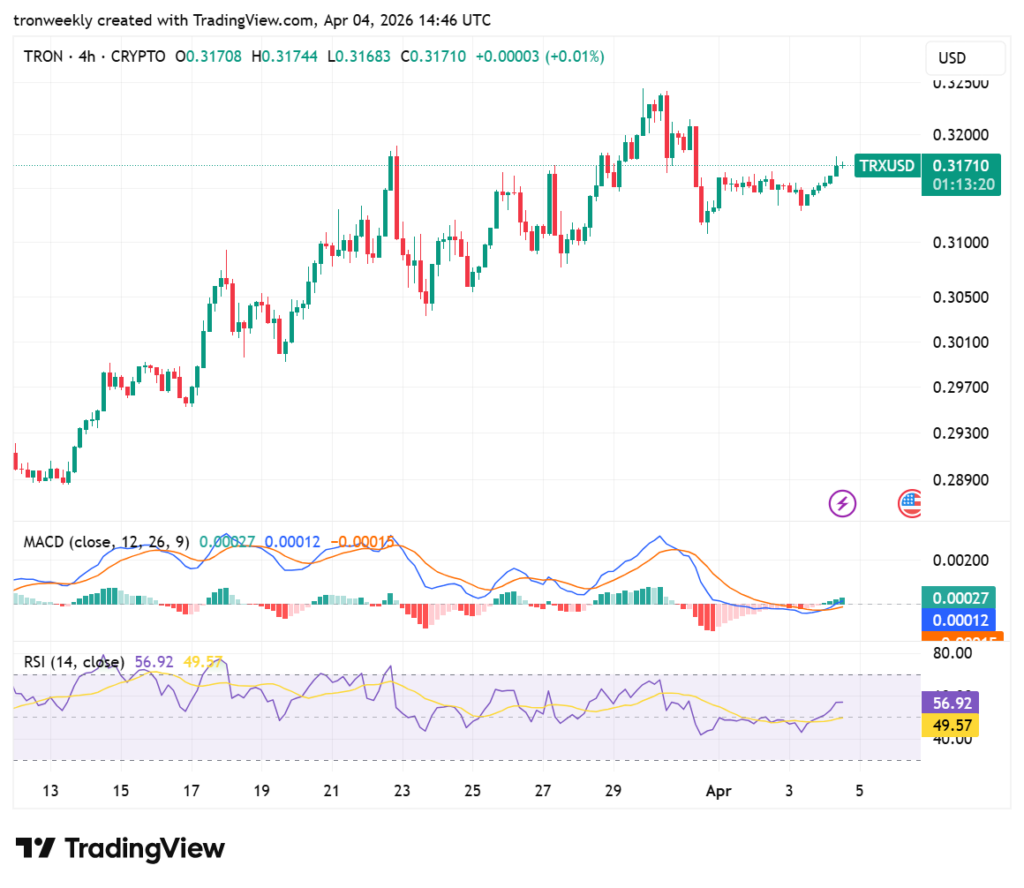
Source: TradingView
RSI now stands at 56.92, suggesting that the asset is in a neutral position with a positive bias. The RSI just bounced off the 40 mark and has breached its moving average line, which suggests increased buying momentum in the market.
There is ample technical space left because the indicator is still far from being at the overbought level of 70.
This article contains market analysis and price predictions. These are not guarantees. Crypto markets are volatile. Always DYOR. Not financial advice.
Also Read: Tron Inc.’s TRX Accumulation Signals Possible Breakout Toward $0.40

Be the first to comment