


What to know:
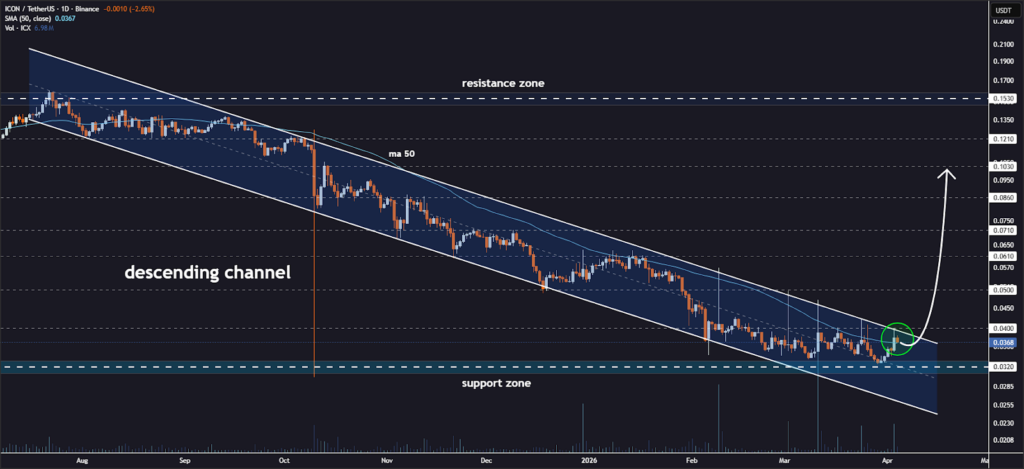
- ICON (ICX) nears a key breakout zone at the upper descending channel resistance, signaling a possible trend reversal.
- ICX holds above key EMAs near $0.0366, showing early bullish momentum after recent recovery.
- An RSI near 58 and a softening MACD indicate slowing momentum, but buyers still maintain control.

ICON (ICX) is approaching a key technical moment as it trades near the upper boundary of a long-standing descending channel on the daily chart.
According to the crypto analyst Jonathan Carter, Momentum indicators are gradually turning bullish, suggesting selling pressure is fading while buyers are gaining strength. Price action is tightening, signaling a potential breakout zone is now within reach.
Source: Jonathan Carter’s X Post

If ICX breaks above resistance, analysts expect a possible trend reversal with upside targets at $0.040, $0.050, $0.061, $0.071, $0.086, and $0.103.
Each level may act as resistance where profit-taking could occur. However, confirmation is essential, as failed breakouts remain possible in volatile crypto market conditions, especially without strong volume support.
Also Read: ICON (ICX) Surges Nearly 100% In Weekly Chart, Poised For Future Growth
ICON (ICX) Technical Outlook Shows Upward Consolidation
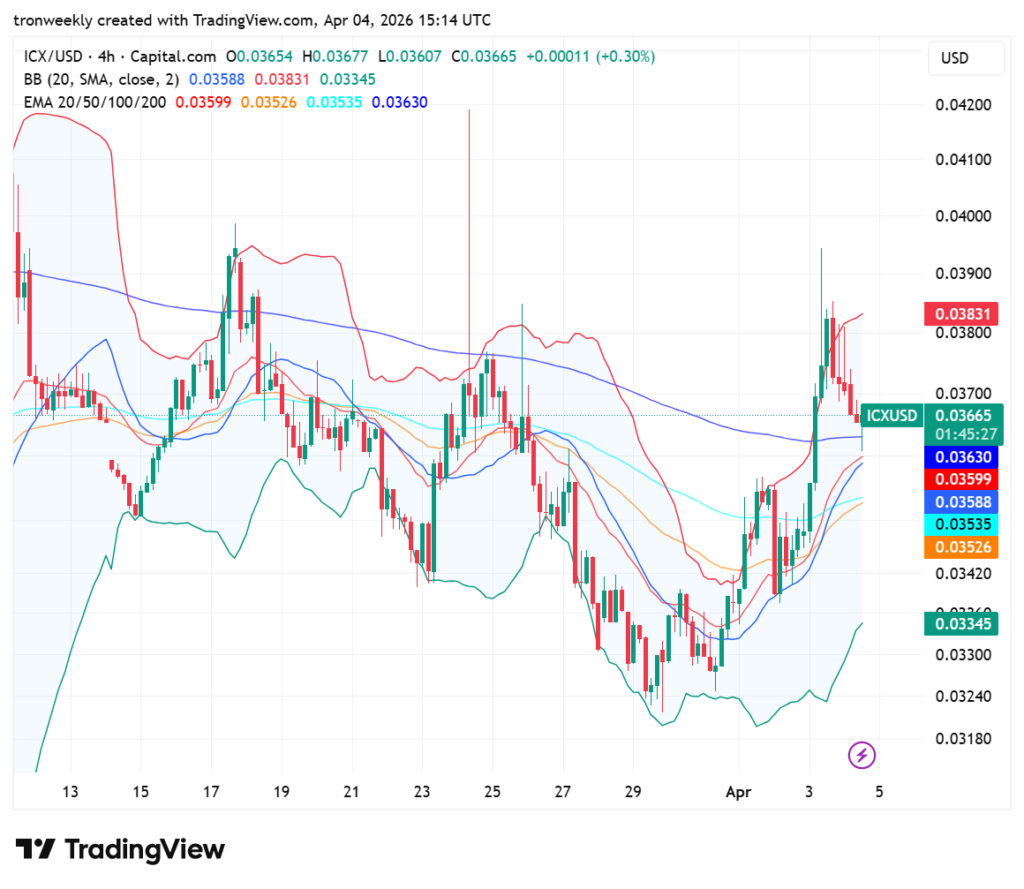
According to TradingView, ICX displays a notable recovery following a deep late-March trough. The price recently surged through the 20, 50, and 100-period EMAs, currently stabilizing near $0.0366.
This bullish impulse successfully tested the $0.0390 resistance level before a slight pullback. Currently, the asset remains positioned above the middle Bollinger Band, indicating a positive shift.
Source: TradingView
The Bollinger bands are expanding, thus implying higher levels of volatility in ICX’s trading. The 200-day exponential moving average line of $0.0363 becomes a vital point for verifying the trend.
Although the exhaustion of the upper wick reveals that there has been selling pressure around $0.0380, the short-term uptrend EMAs offer immediate support to the price.
Momentum Indicators Reinforce Bullish Reversal
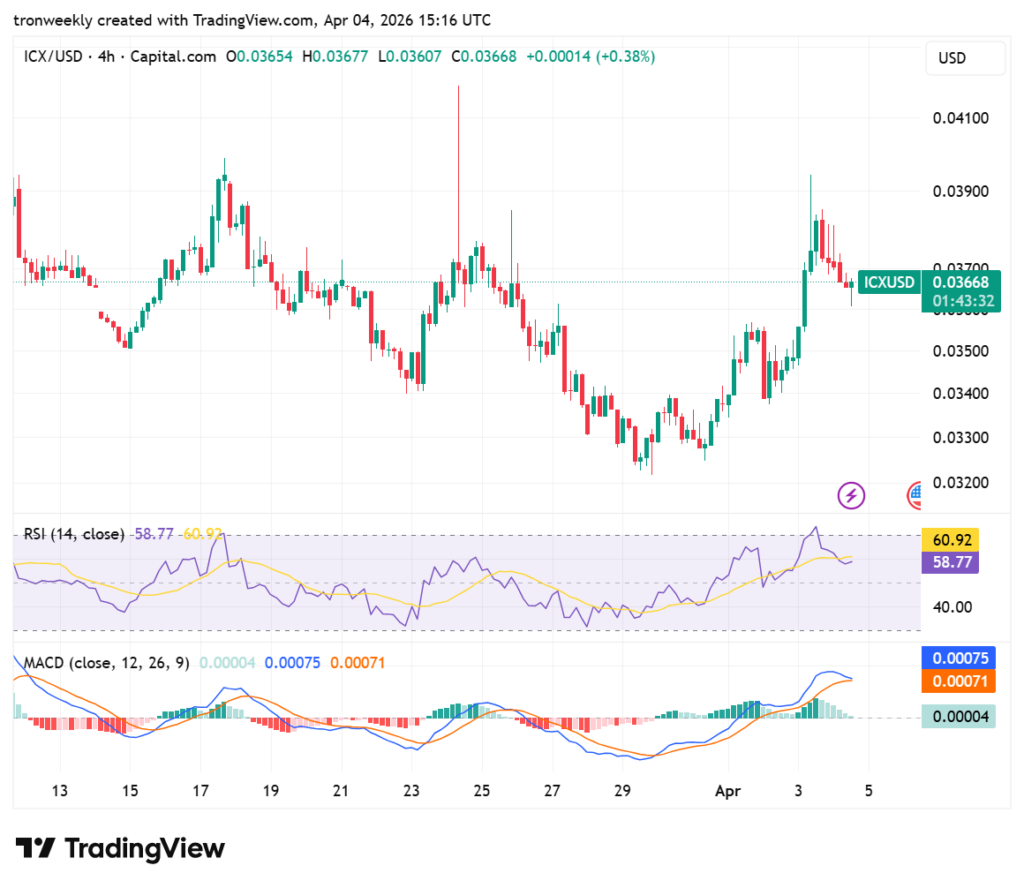
The RSI value is seen at 58.77 and trading just below the signal line. The present positioning shows that although ICX continues to have moderate bullish strength, its previous rally has now come to an end.
As the relative strength index is trading above the neutral level, it suggests that there is a growing possibility of consolidation.
Source: TradingView
The MACD shows a slowing positive trend, with its green bars starting to shrink. Though the line of MACD is currently above the signal line and zero level, the decreasing distance between them indicates a lack of momentum.
The traders need to pay attention to the emergence of a bearish cross, as it will signal changing sentiment.
This article contains market analysis and price predictions. These are not guarantees. Crypto markets are volatile. Always DYOR. Not financial advice.
Also Read: ICON (ICX) Falling Wedge Pattern Signals Potential Surge to $0.044
Be the first to comment