


What to know:
- Pump.fun (PUMP) breaks descending wedge, signaling a potential bullish reversal in short-term price action.
- Momentum remains weak, with RSI at 46.29 and MACD showing limited buyer strength.
- Resistance caps upside, as major MA levels ($0.00189, $0.00214, $0.00302) constrain further gains.

Pump.fun (PUMP) has formed an upward breakout from its descending wedge formation, indicating that the cryptocurrency could be making a reversal to the upside. The asset is now back into focus following the breakout, although the market’s long-term sentiment remains bearish.
At the time of writing, PUMP is trading at $0.001738, with a 24-hour trading volume of $100.71 million and a market capitalization of $579.43 million, according to CoinMarketCap data. The token has posted a 5.21% gain over the last 24 hours, reflecting a modest rebound in price action.
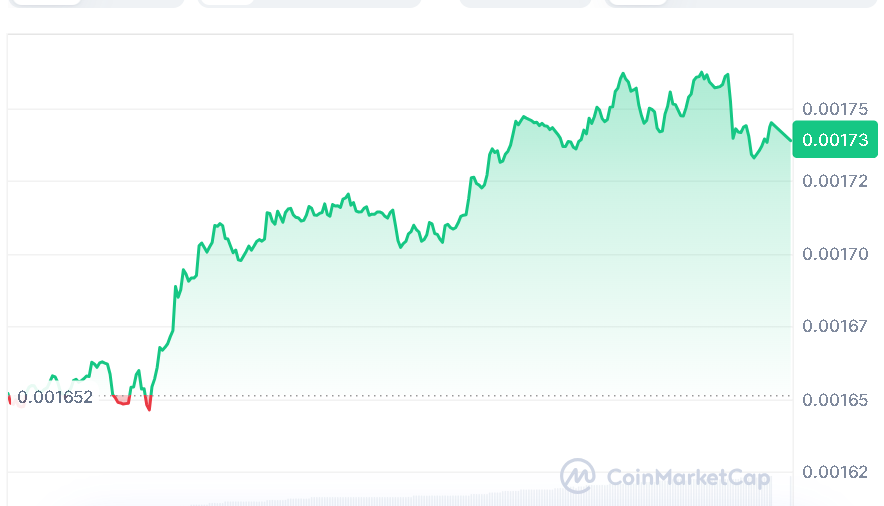
Source: CoinMarketCap

Also Read | Ondo Finance Surpasses $3.5B TVL: ONDO Could Pass $0.28 to Gain Momentum?
PUMP Breakout Signals Bullish Reversal
A crypto analyst, Alpha Crypto Signal, recently pointed out a falling wedge formation seen on the 4-hour timeframe on April 6, 2026, and as predicted, the formation took place. Alpha Crypto Signal observed that the sell-off became weaker towards the latter stages of the formation, which saw PUMP break through the upper trendline.
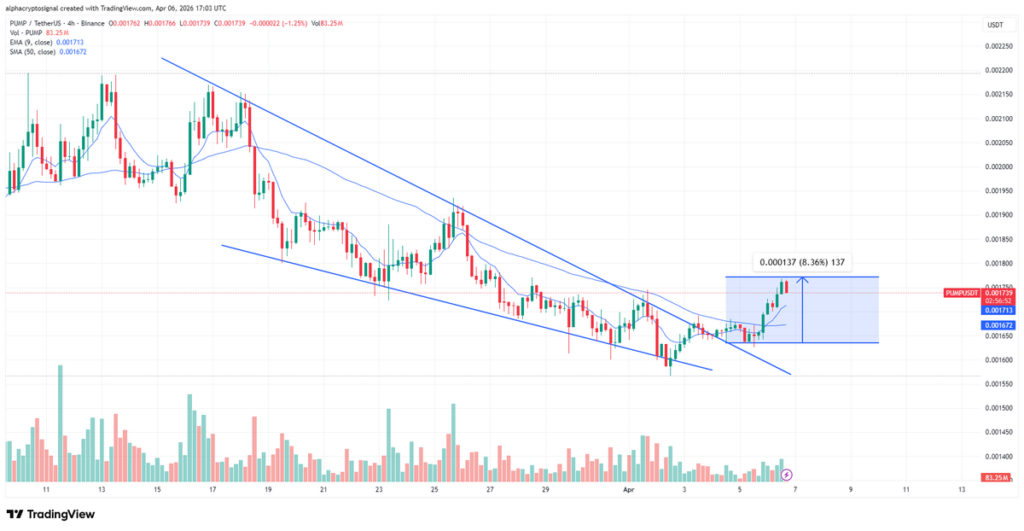
Source: Alpha Crypto Signal’s X Post
The breakout move has already generated an 8% plus rally, and the technical structure should stay bullish provided the price remains above the breakout level. Alpha Crypto Signal also mentioned that there is potential for further gains if momentum improves further.
PUMP Struggles as Indicators Show Weakness
Although there has been an upward surge in price, the technical analysis clearly indicates that the recovery is still very much in the initial stage. Currently, the RSI stands at 46.29, which is slightly higher than the signal level of 40.67. It means that although the momentum is still weak, it seems to be stabilizing.
Meanwhile, the price action of PUMP is also being held down by the major MA ribbon levels of $0.00189, $0.00214, and $0.00302. These levels have proved to be significant hurdles in the path of the token’s further upside move. The overall bias will remain downwards unless these levels are broken.
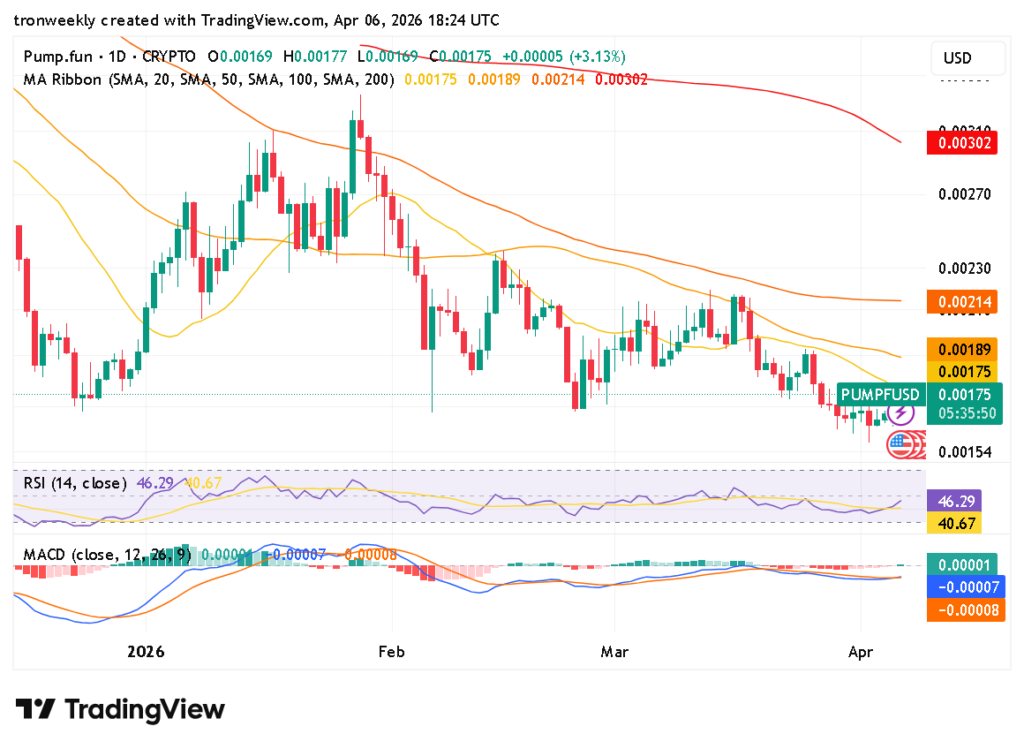
Source: TradingView
Even the MACD technical analysis reveals limited strength. The value on the MACD line is -0.00008, while that for the signal line is -0.00007. However, the histogram has shown limited growth from -0.00001 to 0.00001. This reveals that the attempt by buyers to regain the market has not yet developed much momentum.
Overall, Pump.fun has provided a valid breakout, but the overall trend is still unclear because of the constant resistance at the higher levels. It will take some time for the stock to break through those levels, along with some positive momentum, before there can be a definite upward trend.
Also Read | Cardano (ADA) Price Reclaims Key Level: Can Bulls Push Toward $0.29 Next?

Be the first to comment