


Solana price fell 18% from its March high as global tensions surrounding the U.S. Iran war and an exploit on Solana-based Drift Protocol that drained millions from the ecosystem spooked the market.
Summary
- Solana fell nearly 18% from its March high as a $285M Drift Protocol exploit shook confidence in its DeFi ecosystem.
- Escalating U.S.–Iran tensions and a surge in oil prices dampened risk appetite and reduced rate cut expectations.
- Negative funding rates and declining open interest signal growing bearish pressure in the derivatives market.
According to data from crypto.news, Solana (SOL) price is down 7% from last week’s high of $85.1 and nearly 18% below its highest point in March.

Solana price fell following a $280 million exploit that occurred on Drift Protocol on April 1, a trading venue native to the Solana blockchain. The exploit was one of the largest security breaches in Solana history since the Wormhole incident and has largely eroded investor confidence in the safety of the network’s DeFi ecosystem.
The token also fell amid tensions in the Middle East that continued to drive investor sentiment away from risk assets. U.S. President Donald Trump has threatened to strike key bridges and energy plants in Iran if it does not agree to a deal to open the Strait of Hormuz by the end of today. On the other hand, Iranian officials are pushing for a proposal for a complete end to the war, provided sanctions are lifted, and wartime damages are compensated.
The blockade at the key maritime corridor has pushed crude oil prices up nearly 30% since the war began. Surging oil prices have led to fears of runaway inflation, which in turn has reduced expectations of any interest rate cut by the Federal Reserve this year.
Cryptocurrencies, including Solana, tend to enter a bearish cycle when the expectation of rate cuts seems off the table for the foreseeable future.
The token is also suffering from a lack of demand in the derivatives market. Data from CoinGlass show that the weighted funding rate has moved deeper into the negative territory while the open interest has dropped to $4.92 billion, down from a March high of $5.92 billion.
This means that short sellers are becoming increasingly aggressive, and fewer traders are willing to hold long positions in this volatile climate.
On the daily chart, Solana price has been forming a head and shoulder pattern, a pattern that has often preceded a sustained downside in an asset’s price over the following sessions.
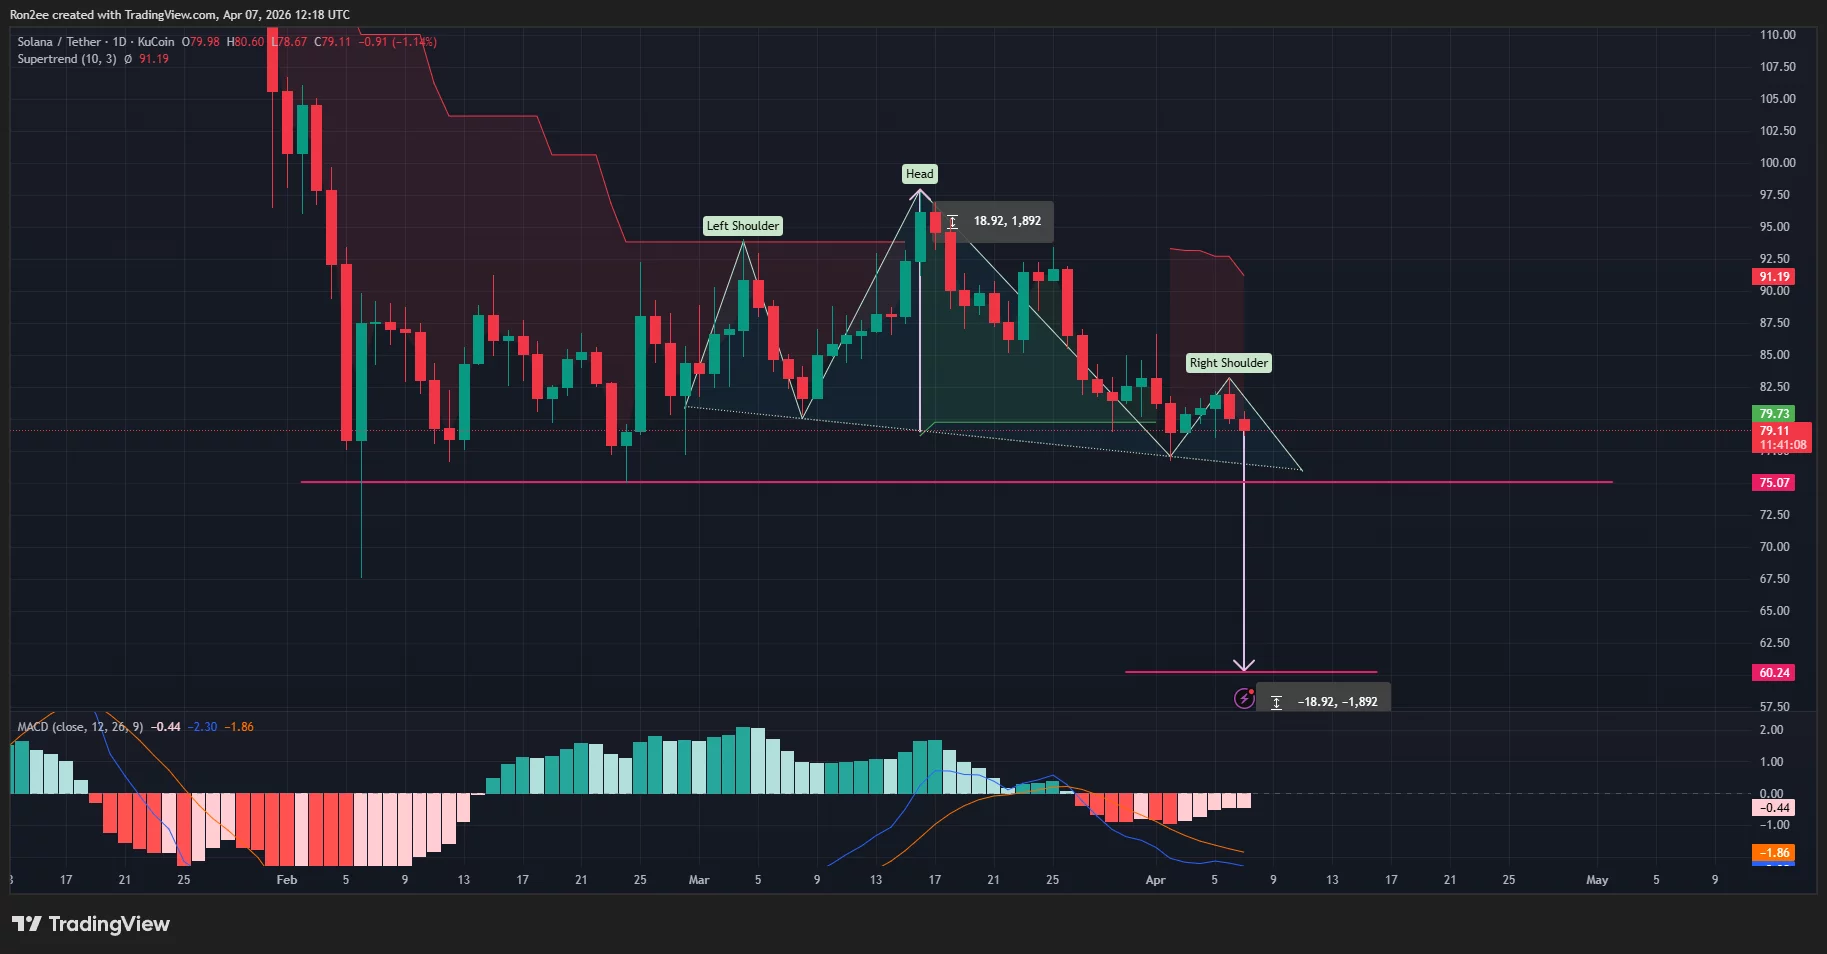
For Solana, a fall below the $75 support, which bulls are currently struggling to defend, could trigger a drop to $60, a bearish projection calculated by subtracting the height of the head and shoulder formed from its current price of $79, putting the bearish target nearly 24% lower.
The Supertrend indicator has flashed a red sell signal, indicating that the short-term momentum has shifted firmly in favor of the bears. Additionally, the MACD lines have pointed below the signal line, which means that the downward trend is gaining strength, and further selling pressure is likely imminent.
Disclosure: This article does not represent investment advice. The content and materials featured on this page are for educational purposes only.

Be the first to comment