


What to know:
- Solana holds near $82 support as rising volume reflects cautious market sentiment.
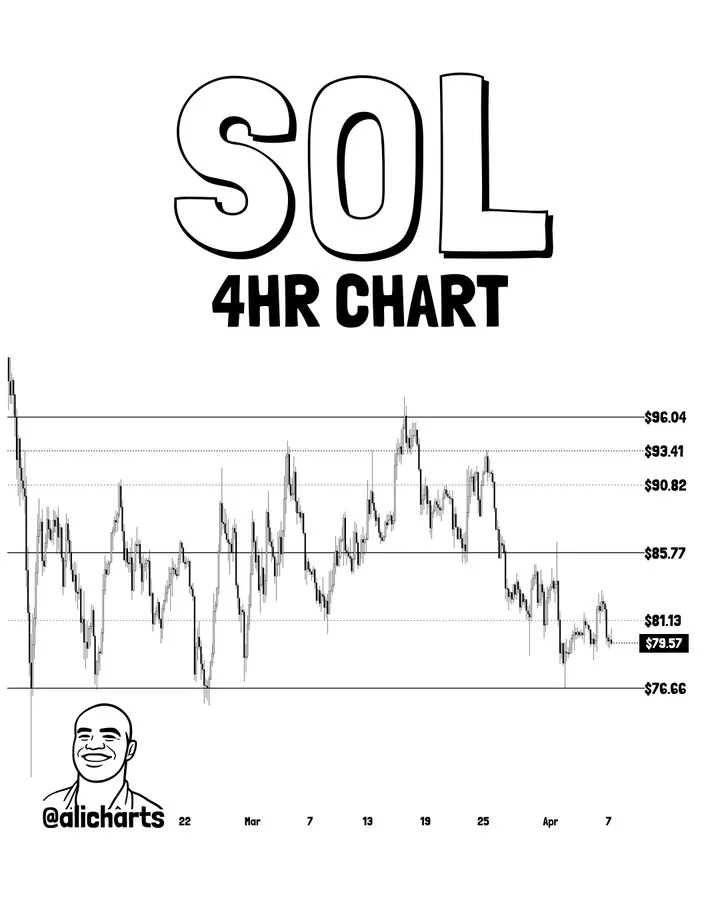
- SOL trades within range, with $76 support and $96 resistance defining direction.
- Derivatives show mixed signals as OI drops, volume climbs, and funding stays positive.

On Wednesday, April 8, Solana (SOL) traded near key support as market participants monitored short-term direction. Price action stayed within a defined range, keeping traders cautious. The asset showed limited movement despite rising activity, signaling uncertainty across the broader crypto market.
According to CoinMarketCap data, Solana (SOL) trades at $82.02, up 0.17% in the last 24 hours. Trading volume increased 10.68% to $4.09 billion. Over the past seven days, the token declined by 1.19%, reflecting mild downside pressure.
Also Read: Solana Foundation Launches STRIDE to Boost Protocol Security

Solana Near Key Level as April Trend Decides
According to crypto analyst Ali Martinez, Solana still trades within a horizontal consolidation channel. The pattern demonstrates resistance levels of $96.04 and support levels of $76.66. The asset has drifted towards the lower boundary after weeks of bearish pressure.
The analyst said that the NEXT 48 hours will determine the trend for the month of April. A breakout above $76.66 could be a confirmation of a double bottom pattern or channel bounce. This could drive the price towards $83.00 as the primary target.
A breach above $83.00 could see an extension towards $85.00, which coincides with an important resistance level. However, a daily close below $76.66 could invalidate the channel pattern. This could set further targets at $68.54 and $50.
EMAs and Bollinger Bands Highlight Bearish Pressure
Technical indicators show price trading below their short-term exponential moving averages. The 20-day EMA is trading at $83.62, while the 50-day EMA trades at $88.44. Both serve as immediate resistance points for any bullish moves.
The prevailing trend continues to be weak relative to the longer-term averages. The 100-day EMA trades at $100.85, while the 200-day EMA is at $121.73. Prices are far below both averages, suggesting persistent bearish momentum.
Bollinger Bands demonstrate low volatility and narrow price ranges. The upper band is currently trading at $92.67, while the middle band trades at $84.54. Meanwhile, the lower band sits at $76.41, close to the current support level.
Derivatives Reflect Uncertain Market Sentiment
CoinGlass derivatives data shows mixed market activity. Open interest dropped by 1.48% to $4.95 billion. Trading volume climbed by 11.01% to $12.26 billion, while the funding rate is at 0.0039%.
This article contains market analysis and price predictions. These are not guarantees. Crypto markets are volatile. Always DYOR. Not financial advice.
Also Read: Toncoin (TON) Tests $1.10 Support As Bulls Eye $1.70–$2.30 Range

Be the first to comment