


What to know:
- ARB nears $0.105 resistance as the price rises with strong volume and market activity.
- Falling wedge and inverse H&S patterns point to possible breakout above $0.105.
- An RSI above 50 and a MACD trend shift suggest weakening bearish momentum.

Arbitrum (ARB) token is trading near a key resistance zone on Thursday, April 9, as price action strengthens and trading activity rises across spot and derivatives markets. Traders are focused on the $0.105 level, which may define the next move.
As of writing, Arbitrum (ARB) is trading at $0.1003, marking a 5.63% increase in a day. The trading volume is showing a strong bullish surge up 105.78% and is currently standing at $122.86 million. Over the last week, the coin has gone up by 6.23%, according to CoinMarketCap.
Also Read: Binance Coin (BNB) Near Key Zone: Will $620 Trigger Breakout?

ARB Tests Falling Wedge Resistance
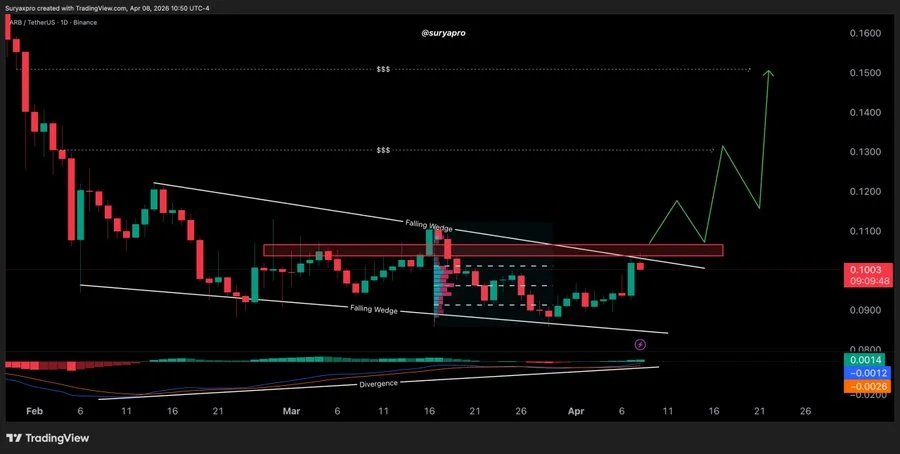
Crypto analyst Surya highlighted that ARB remains inside a falling wedge structure. Price has pushed into the $0.100 to $0.105 resistance range, which aligns with the upper boundary of the pattern.
He noted that a clean breakout and acceptance above $0.105 could open a move toward the $0.120 to $0.150 liquidity zone. Until that level is cleared, the price may continue to consolidate within the current structure.
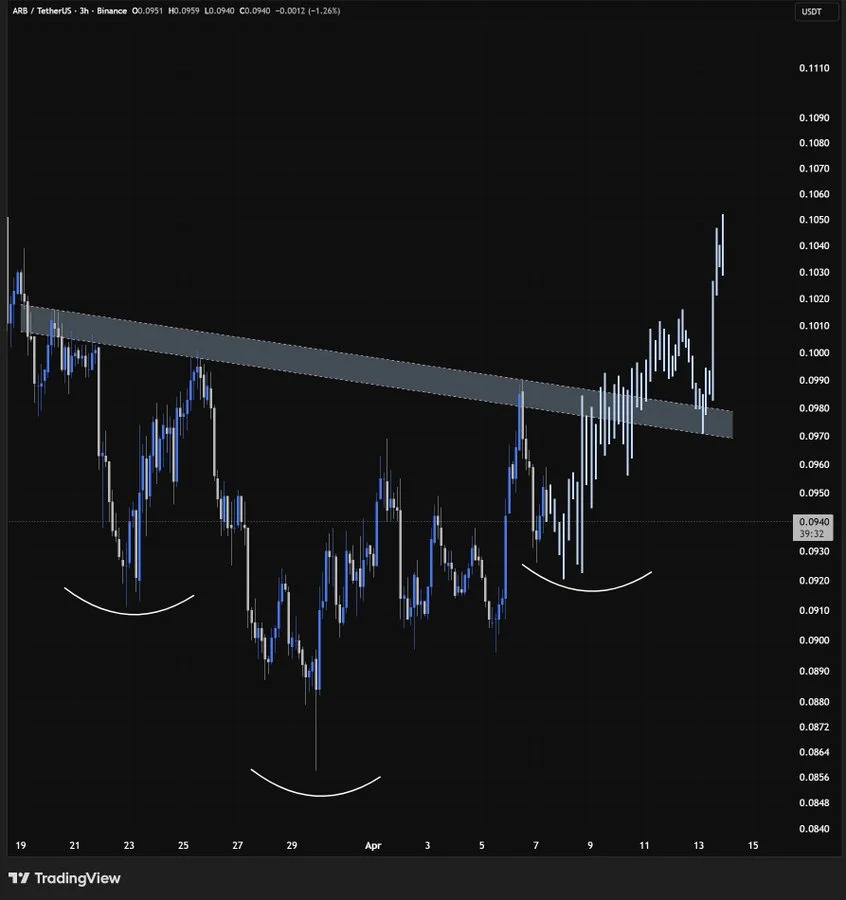
Additionally, another analyst, Trader Symba, mentioned an emerging inverse head and shoulders formation. The pattern shows a left shoulder, head, and right shoulder taking shape. The price action is moving closer to the neckline resistance, which is at around $0.105.
Confirmation of a breakout above this neckline would be seen as valid, and this could potentially clear the way for price action to move towards the $0.120-$0.130 levels.
Rising Open Interest Signals Mild Bullish Positioning
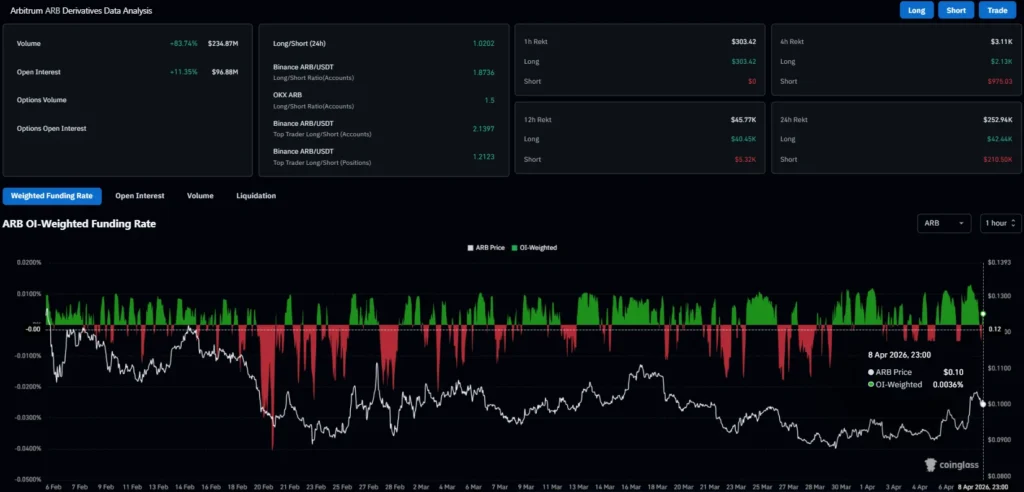
According to CoinGlass data, future volume has gone up by 83.74% to $234.87 million. Open interest has increased by 11.35% to $96.88 million. The OI-weighted funding rate is currently at 0.0036%, pointing to a mild bullish bias in positioning.
RSI Strengthens as MACD Hints at Bullish Shift
The Relative Strength Index (RSI) shows improvement in momentum. The RSI is at 54.50, whereas its moving average is at 42.94. This indicates that momentum is currently in positive territory. It is above the neutral area but not in overbought conditions.
The Moving Average Convergence Divergence (MACD) shows a slow trend shift in strength. The MACD line is at 0.0014, whereas the signal line is at -0.0012.
The histogram value is -0.0026. Narrowing of the MACD and the signal line gap suggests that bearish strength is being reduced as price consolidation develops.
ARB continues to trade near a decisive level. Market participants are watching for confirmation above resistance. A sustained move could define the next directional trend.
This article contains market analysis and price predictions. These are not guarantees. Crypto markets are volatile. Always DYOR. Not financial advice.
Also Read: Arbitrum (ARB) Defends Critical Support, Targets Explosive Move Toward $0.92

Be the first to comment