


What to know:
- Dogecoin (DOGE) is trading in a consolidation range near $0.091 as market volatility limits movement.
- A symmetrical triangle pattern suggests a potential 29% move after a breakout or breakdown.
- RSI near 47 and a flat MACD reflect neutral sentiment and weak momentum.

Dogecoin (DOGE) is moving in a downward consolidation phase due to the presence of high volatility in the crypto market. According to CoinMarketCap, as of Thursday, April 9, the DOGE price has declined by 2.62% over the last 24 hours but remains 2.02% up over the last week.
At the time of writing, DOGE is trading at $0.09168, with a trading volume of $20.59 million, which has declined by 49.1% over the last 24 hours. However, its market capitalization stands at $14.09 billion, which is also down by 11.68%.
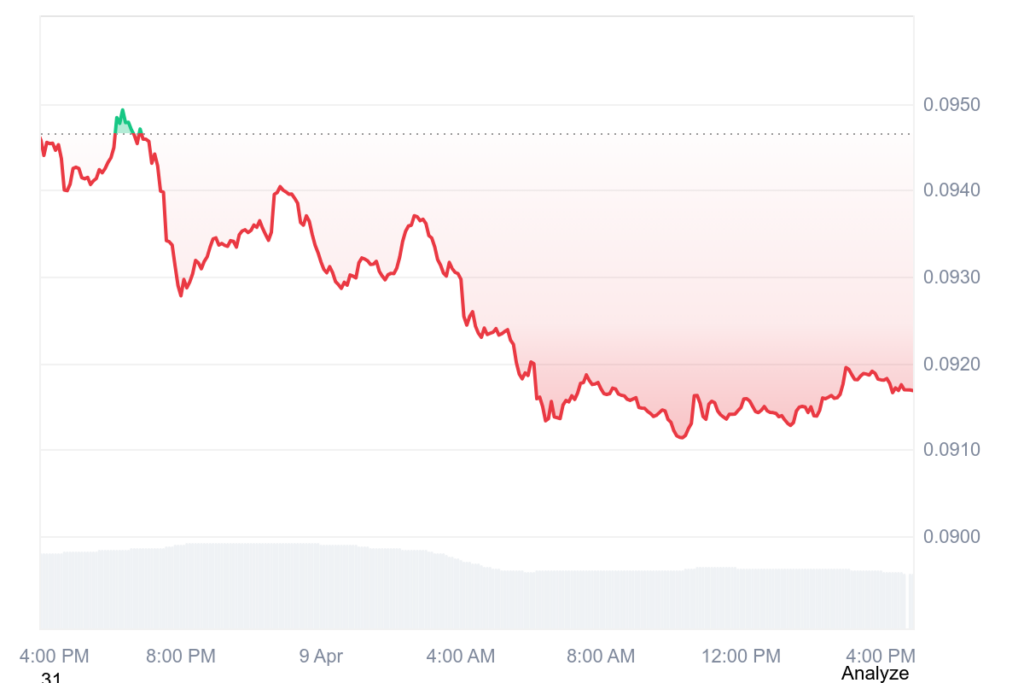
Source: CoinMarketCap

Also Read: Dogecoin Holds Key Support as Breakout Setup Builds Toward $0.11
Dogecoin Triangle Pattern Signals 29% Breakout Move
Furthermore, the crypto analyst Ali Charts pointed out that Dogecoin (DOGE) is drawing renewed market attention as its price compresses within a symmetrical triangle pattern, a technical formation that often precedes sharp volatility.
The structure reflects tightening price action marked by lower highs and higher lows, signaling growing pressure between buyers and sellers as the asset approaches a decisive breakout point very soon ahead.
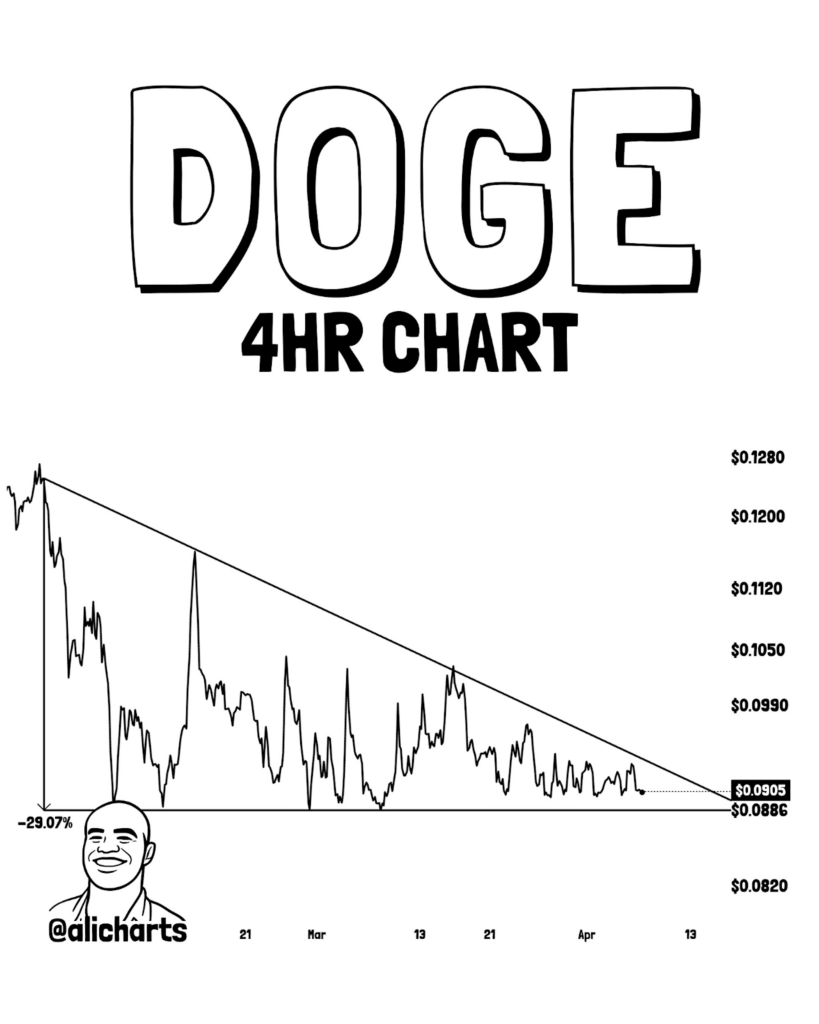
Source: Ali Charts’ X Post
However, the breakout can result in a possible swing of about 29%. The occurrence of an effective breakout amid high volume might provide the direction; otherwise, there is a likelihood of misleading indicators.
With the triangle nearing its peak, the market participants are keeping a keen eye on developments that might facilitate the next major price rally of Dogecoin.
DOGE Faces Pressure Below Key Moving Averages
According to TradingView, there is a consistent bearish trend for DOGE. The current price of $0.09167 indicates that the token is not able to break through resistance levels.
The current price of DOGE remains below important technical indicators such as the 200-day SMA ($0.14135). Tight consolidation indicates that sellers have exhausted their efforts, but buyers are not participating significantly.
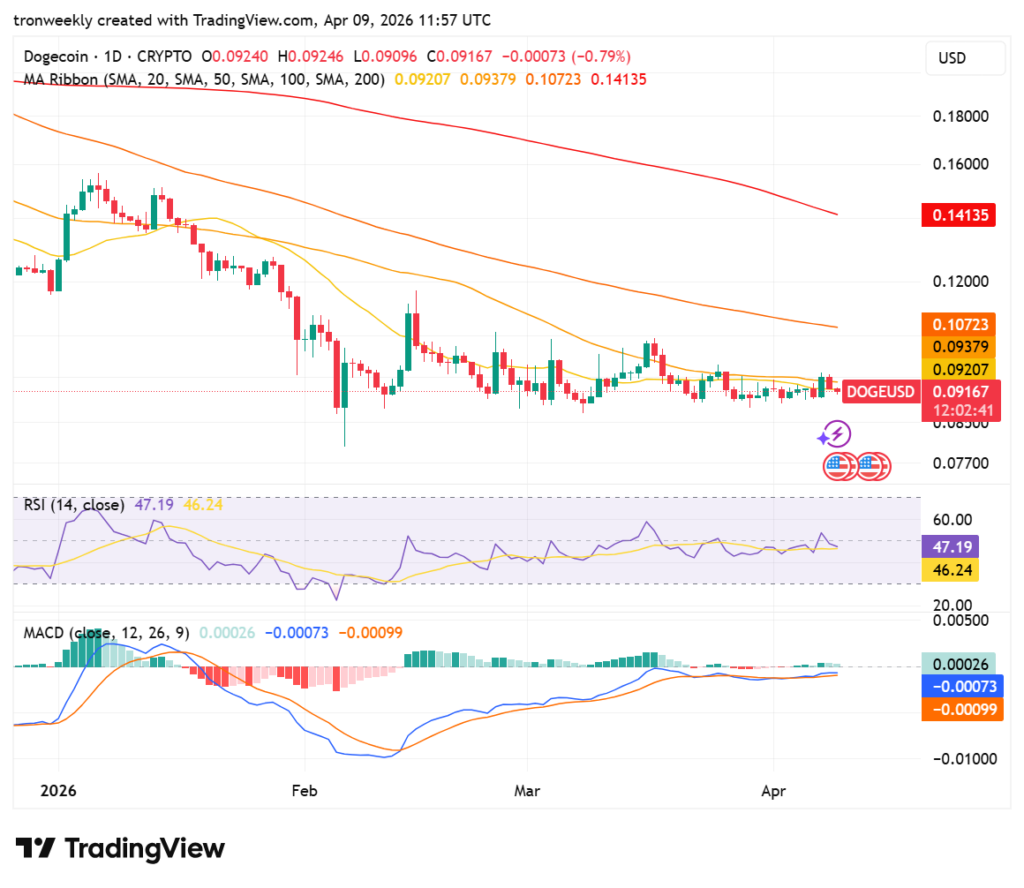
Source: TradingView
The momentum indicators show a strong sign of indecision and neutrality in the market. The RSI is at 47.19, positioned in a middle ground between an overbought and oversold situation.
Furthermore, the MACD lines are showing a flat signal on the chart around the zero level, suggesting that the trend has lost all its power.
This article contains market analysis and price predictions. These are not guarantees. Crypto markets are volatile. Always DYOR. Not financial advice.
Also Read: Dogecoin Price Rejected at Kumo Resistance, Downtrend Holds

Be the first to comment