


What to know:
- XRP struggles near $1.32 as sellers block breakout, maintaining pressure during critical retest phase.
- Analyst highlights long-term breakout structure remains intact despite short-term weakness and consolidation signals.
- Price stays below key moving averages while RSI and MACD indicate weak bullish momentum.
XRP has reached a crucial period of retesting after a breakout in a period spanning several years, despite the continued selling pressure, which is preventing it from breaking out above the resistance level. According to the analyst, the structure of the entire market has not been affected.
At press time, XRP is trading at $1.32, with a 24-hour trading volume of $3.34 billion and a market capitalization of $81.62 billion, according to data from CoinMarketCap. The token has declined by 3.56% over the last 24 hours, reflecting continued bearish pressure while investors monitor whether support can hold.
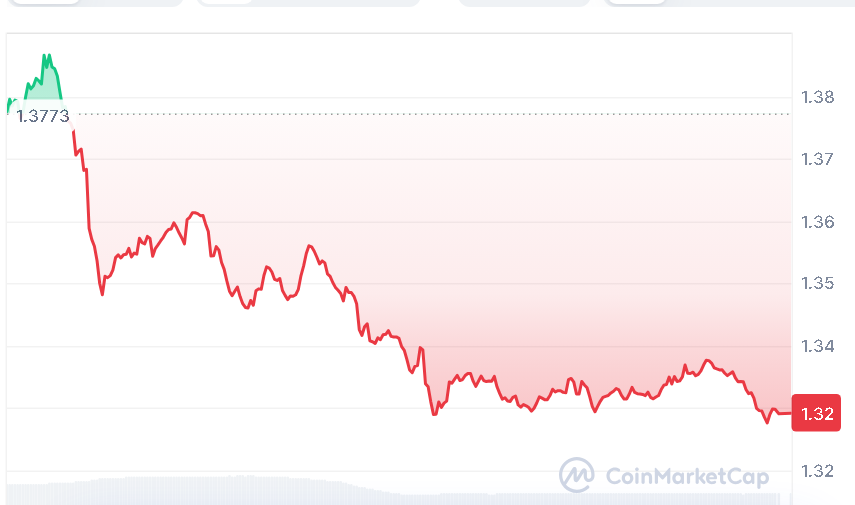
Source: CoinMarketCap

Also Read | XRP Price Faces Key Resistance as Market Consolidates Near $1.33
XRP Pattern Mirrors Previous Bull Cycles
In an analysis posted by ChartNerd on X (Twitter), it was noted that there is a possibility that the major breakout chart pattern of the XRP cryptocurrency is already in place after several years of formation.
As mentioned by ChartNerd, the breakdown from a long-term symmetrical triangle, which took several years to form in multiple cycles, occurred in the fourth quarter of 2024, resulting in the formation of a new all-time high in July 2025.
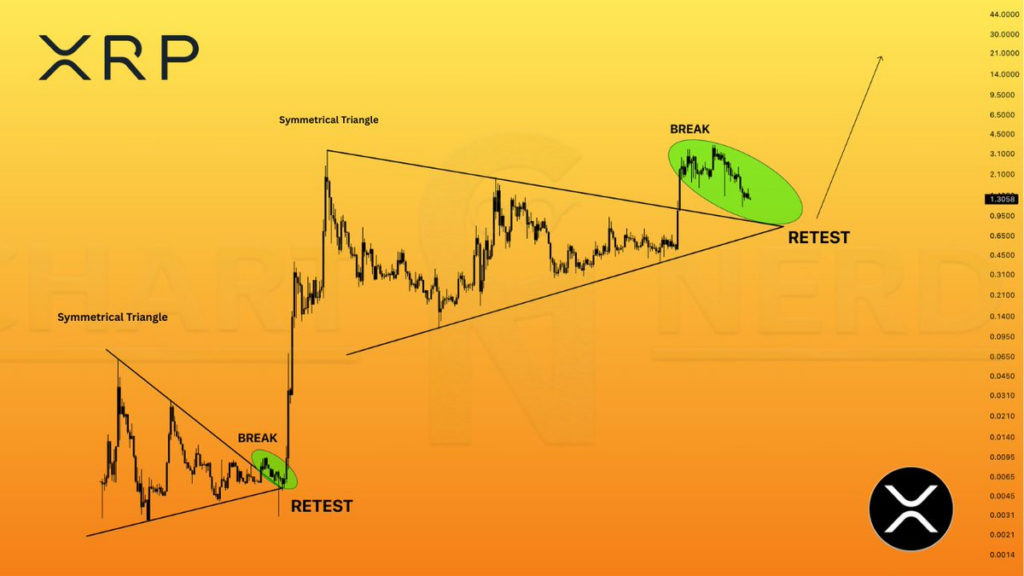
Source: ChartNerd’s X Post
However, at present, XRP seems to be going through an important stage of retesting. The analyst drew comparisons between the present situation and previous trends that took place in 2013 and 2017 when XRP underwent consolidation, breakout, retesting, and then witnessed a powerful move higher. Therefore, the current period is likely to be a continuation pattern.
Despite the longer-term perspective, short-term metrics indicate that XRP continues to experience significant obstacles in its current market environment.
XRP Slips as Momentum Stays Weak
XRP is hovering around $1.32770 while remaining below important levels of the MA Ribbons at $1.66722, $1.81324, and $2.23505, depicting a definite trend downwards. However, XRP has been able to remain above the 200 MA at $1.14887 despite a considerable amount of resistance. The RSI stands at 32.44, lower than the average of 34.24, indicating low buying strength and near-oversold conditions.
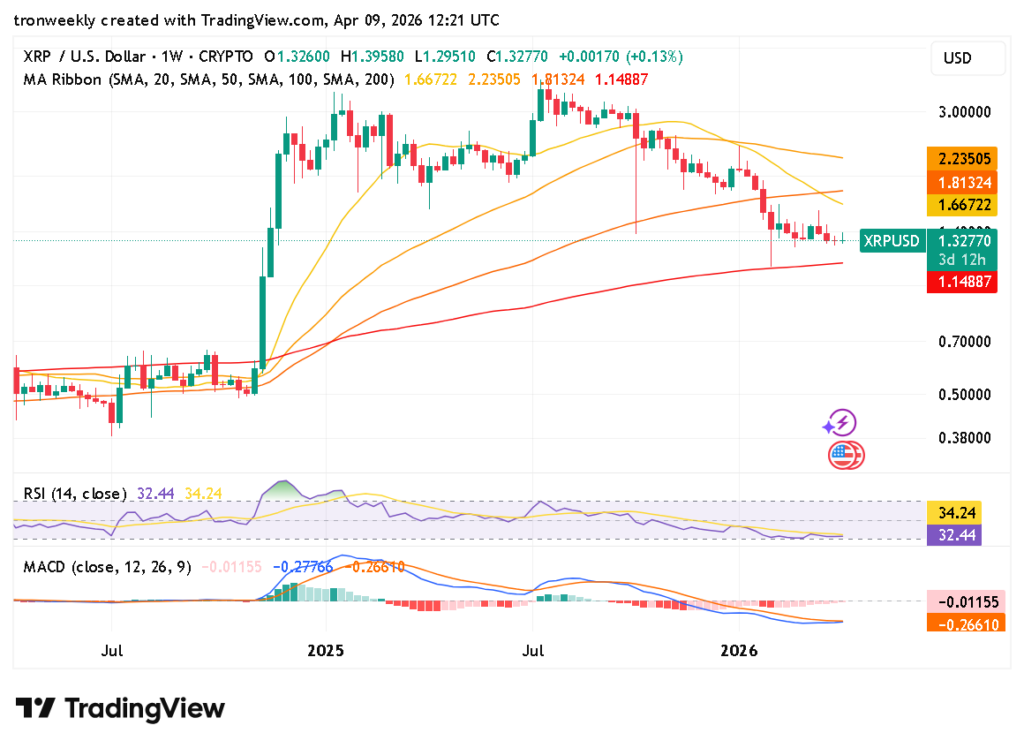
Source: TradingView
MACD still indicates bearish momentum as the MACD Line, which stands at -0.01155, stays lower than the Signal Line, which is at -0.26610. The Histogram also shows negative values of about -0.27766, indicating further selling activities. This means that momentum is still low, hence making it hard for XRP to recover.
This article contains market analysis and price predictions. These are not guarantees. Crypto markets are volatile. Always DYOR. Not financial advice.
Also Read | Cardano Struggles Below Key Averages as Sellers Regain Market Control

Be the first to comment