


What to know:
- ALICE is testing a key support zone within a descending channel, where buyers are beginning to show renewed interest.
- Rising trading activity suggests possible accumulation, which could support a gradual recovery if momentum continues.
- Technical indicators, including RSI above 50 and a bullish MACD crossover, point to improving market strength.

ALICE is moving in a downward direction despite the changing conditions in the crypto market. According to CoinMarketCap, ALICE price has declined by 7.78% over the last 24 hours, but remained up by 2.76% over the last week.
At the time of writing, ALICE is trading at $0.1151, with a trading volume of $14.41 million, which has declined by 5.52% over the last 24 hours. However, its market capitalization stands at $11.55 million, which is also down by 7.77%.
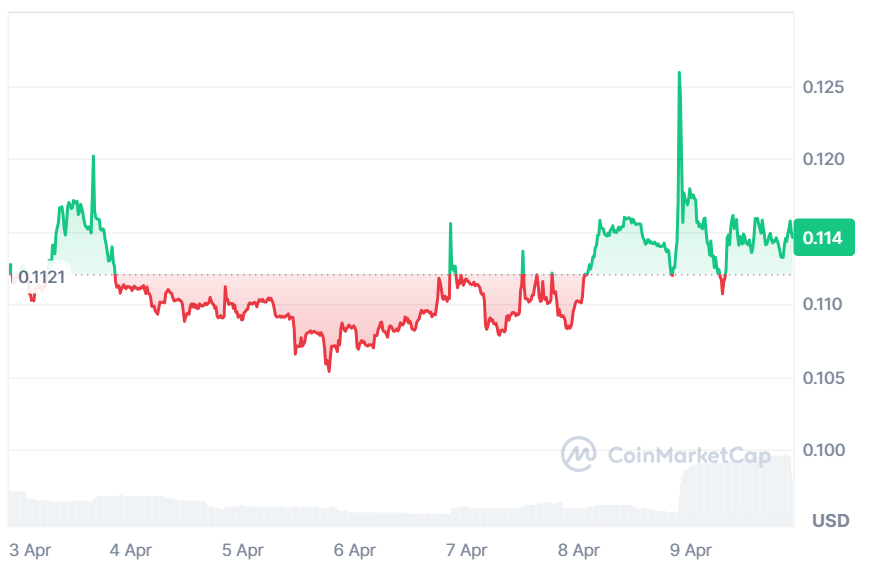
Source: CoinMarketCap

Also Read: FLOKI Price Targets $0.000055 Rally After Major Exchange Listing on Bitkub
ALICE Price Signals Recovery From Key Support Zone
Furthermore, the crypto analyst Jonathan Carter, highlighted that ALICE is showing early signs of recovery after testing the lower boundary of its weekly descending channel.
Buyers have stepped in at this key support zone, preventing further breakdown and gradually increasing volume, suggesting potential accumulation. Market participants are closely watching whether this defense can trigger a sustained bullish reversal attempt.
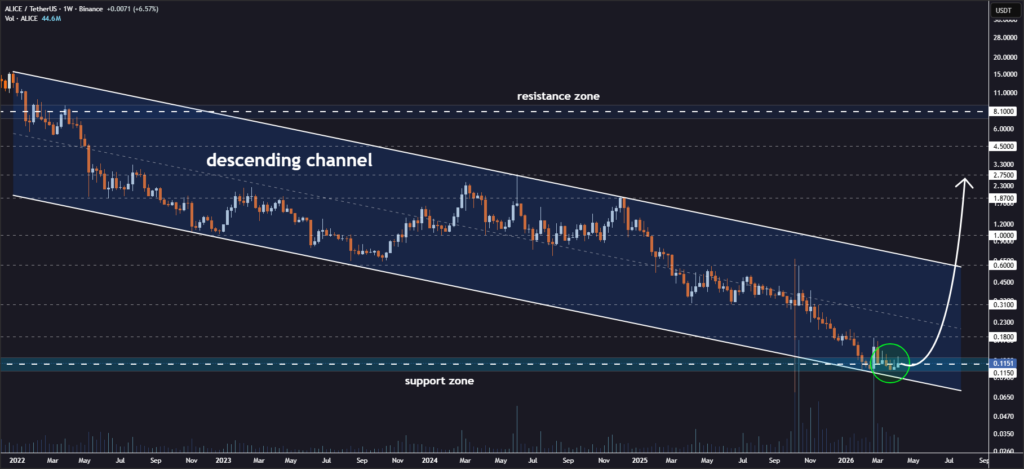
Source: Jonathan Carter’s X Post
If momentum continues, ALICE could begin a staged recovery toward key resistance levels at $0.18, $0.31, $0.60, $1, $1.87, and $2.75.
However, the broader downtrend remains intact until a confirmed breakout occurs above the channel. Traders are viewing this area as a critical decision zone between continued decline or a potential mid-term trend reversal.
Momentum Indicators Support Upward Potential
According to TradingView, RSI is currently oscillating around 52.55, suggesting an improvement from bearish to neutral trend. Since it is trading above the centerline, this implies that buyers’ enthusiasm is gradually gaining traction but not yet in oversold territory.
It has been steadily rising after its consolidation phase, giving enough space for the token to maintain its uptrend.
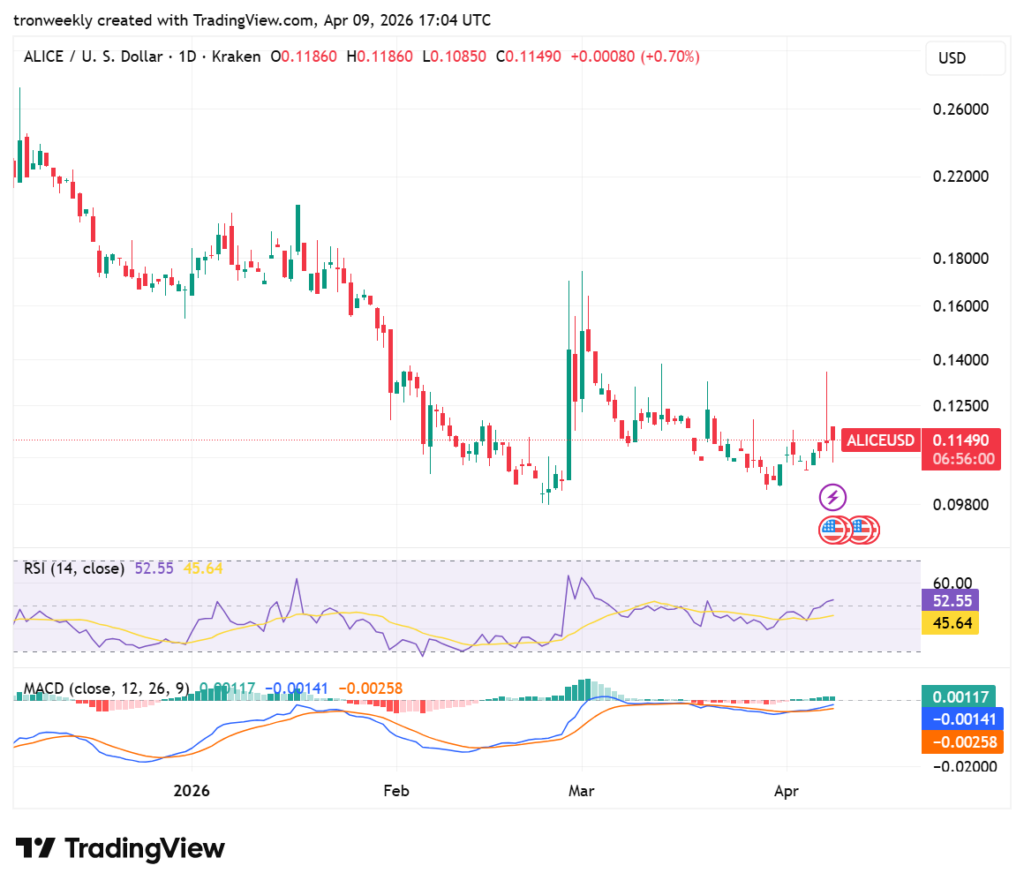
Source: TradingView
Bullish convergence occurs due to the crossing of the blue line above the orange line on the MACD chart. The validity of the bullish convergence is supported by the change of color to green on the histogram.
This shows that the downtrend is weakening. Even though both lines are still under the zero level, the rising positive slope indicates a possible reversal.
This article contains market analysis and price predictions. These are not guarantees. Crypto markets are volatile. Always DYOR. Not financial advice.
Also Read: Aave’s MiCA Approval Sparks $300B Stablecoin Boom

Be the first to comment