


What to know:
- SUI gained over 3% after breaking out of consolidation, holding above key support and signaling a potential short-term rebound amid weakening selling pressure.
- RSI at 53.72 and improving MACD suggest mild bullish momentum, though the broader trend remains bearish for now.
- Key resistance levels at $1.15 and $1.64 must be reclaimed for a sustained recovery and confirmed trend reversal.

SUI gained more than 3%, having broken above a consolidation phase and maintained itself above a critical support level, suggesting a possible bounce back due to weakening selling momentum. Nonetheless, the general direction is bearish, with high resistance blocking any rally.
At the time of writing, SUI is trading at $0.94, recording a 24-hour trading volume of approximately $524 million and a market capitalization of $3.71 billion, according to CoinMarketCap. The price has increased by about 4.17% over the last 24 hours, reflecting renewed short-term market interest.

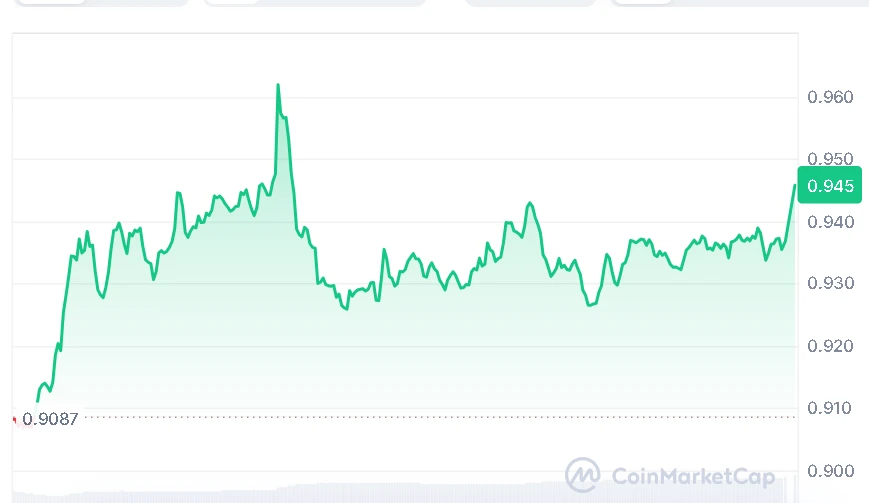
Source: CoinMarketCap

Also Read | Litecoin (LTC) Shows Strength: ETF Listings Eye $58 Break
SUI Breakout Signals Short-Term Upside
In his X post, a crypto analyst, BitGuru, highlighted that SUI has managed to break out from its consolidation pattern and is currently trading above an essential support level.


Source: BitGuru’s X Post
BitGuru stated that if this level holds, then there could be an acceleration of the upmove in the short run. Nevertheless, BitGuru also adds that the investors should wait for further indications of a trend change before entering new trades, since at the moment, there is no indication that the trend has changed.
SUI Indicators Turn Mildly Bullish
Analytically, the price of SUI is trading around $0.945, while its RSI stands at 53.72. This signals a moderate bullish trend since the RSI has surpassed the neutral point, which implies that there is reduced selling pressure on the coin, but no significant bullish trend yet.
MA Ribbon exhibits sustained bearishness. Prices remain around $0.90-$0.92, while the resistance lies at $1.15 and $1.64. Recovery may happen, although an increase will be possible only upon flipping the resistance and greater buying pressure.
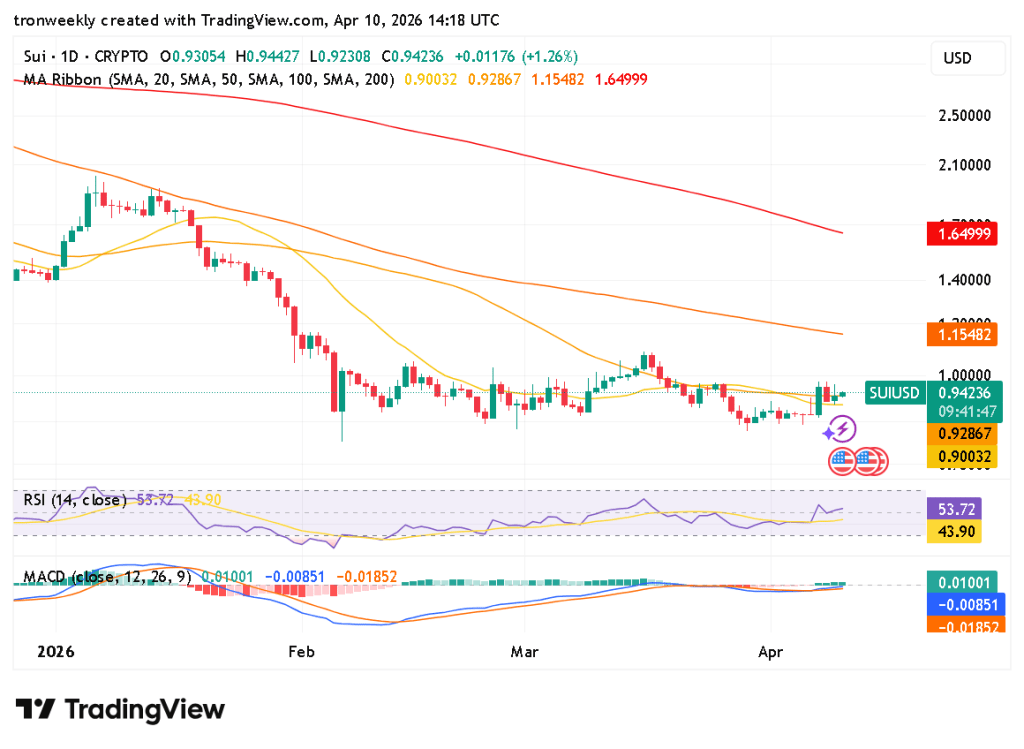
Source: TradingView
The MACD indicator is becoming better, since the MACD line has crossed over the signal line, while the histogram is showing less negativity. This could be an indication that the downtrend may be losing its strength soon.
Overall, SUI is strong in its early stages following the breakout, although its prospects will depend on whether it manages to hold its support levels and overcome resistance levels.
This article contains market analysis and price predictions. These are not guarantees. Crypto markets are volatile. Always DYOR. Not financial advice.
Also Read | PancakeSwap (CAKE) Holds $1.50 as $10 Breakout Setup Builds

Be the first to comment