


What to know:
- Bitcoin remains above recent levels but shows weakening short-term momentum, signaling possible downside pressure.
- Key long-term support zone is forming around $56,000–$60,000, which may act as a potential accumulation area.
- Indicators like RSI (46.9) and MACD suggest declining buying strength and increasing selling pressure.

Bitcoin is showing mixed signals by staying above its previous levels, but the short-term momentum is declining. There is a significant level of resistance in the long term, which has proven itself in the past by bouncing back strongly.
At the time of writing, Bitcoin is trading at $72,738 with a 24-hour trading volume of $ 46.48 billion and a market capitalization of $ 1.46 trillion. BTC price increased 0.63% over the last 24 hours, according to CoinMarketCap.


Source: CoinMarketCap

Also Read | $500 Million Oil Bet Sparks Insider Trading Fears in White House
Bitcoin Approaches Key Long-Term Trendline
On April 11, 2026, the crypto analyst, Ali Martinez, mentioned an established trendline on the higher side, which has contributed significantly towards creating price patterns in the history of Bitcoin.
As per the analysis, this trendline has served as an important structure for more than a decade, and any retest of price on this line has resulted in strong gains.

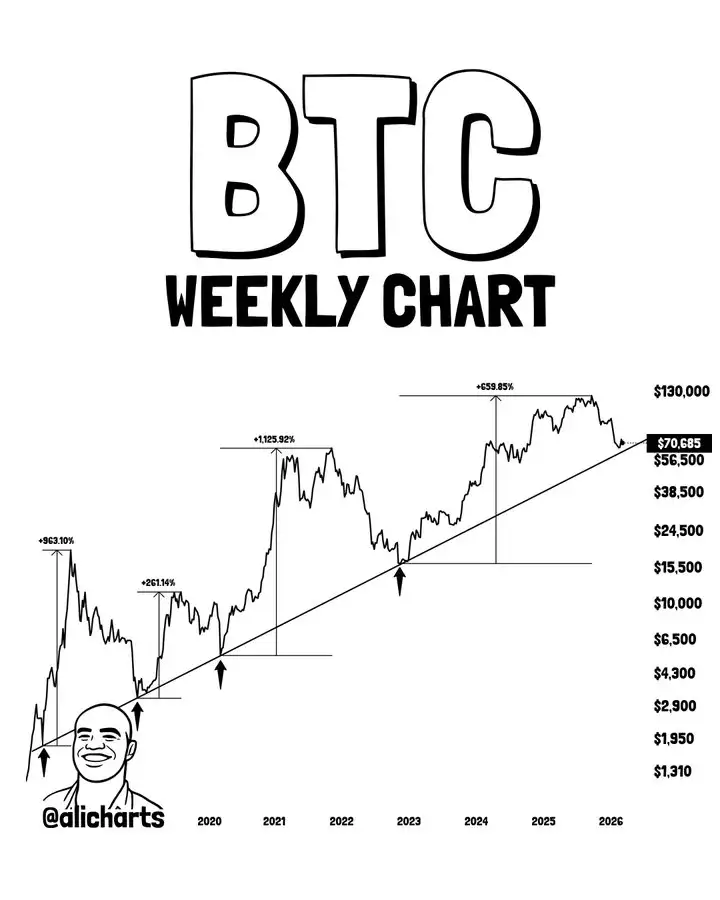
Source: Ali Martinez’s X Post
The historical data provided by Matinez indicates that each time the trading area was visited, there was an expansion in the prices, with the gains being 963% in 2017, 261% in 2018, 1,126% in 2020, and 660% in 2022.
In view of the present market setup, Bitcoin seems to be slowly moving towards this crucial level again, which falls in the $56,000 to $60,000 bracket. This particular area is seen as a possible accumulation zone, as prior accumulation has been made here before any significant uptrend cycle.
Bitcoin Momentum Weakens Across Indicators
However, even with having more than $72,000 in value, Bitcoin’s short-term analysis indicates weakening strength. The asset is currently trading below its 200-day Moving Average at $90,559, its 100-day Moving Average at $58,221, and its 50-day Moving Average at $38,783. Therefore, a mixed formation is observed as the market continues to be in transition.
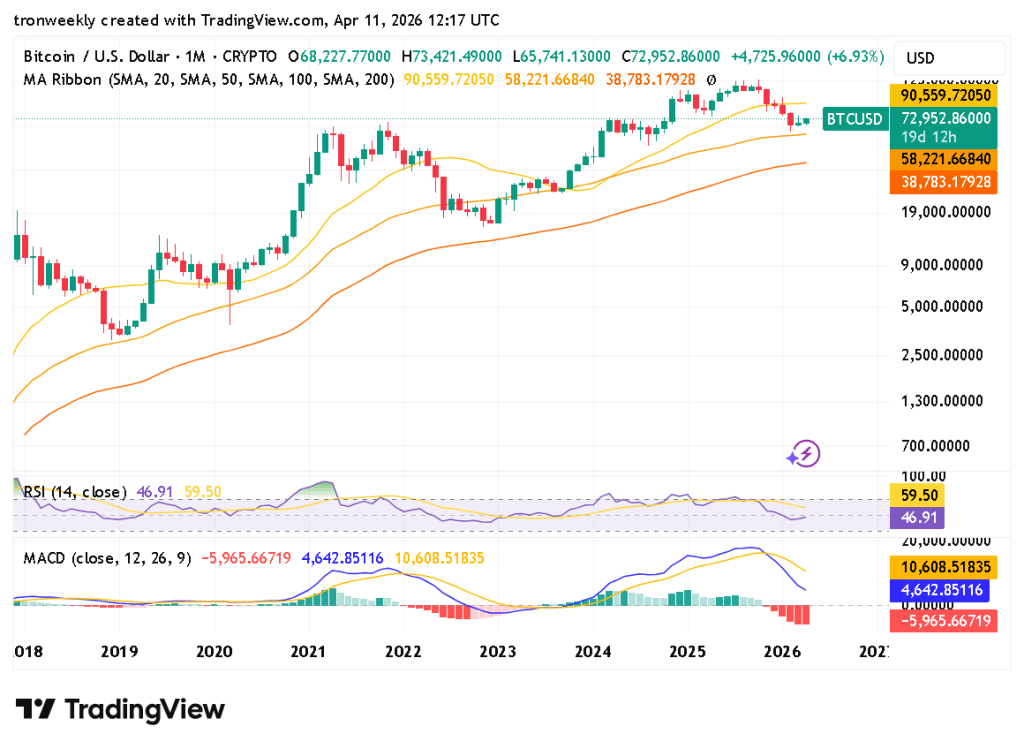
Source: TradingView
Similarly, momentum oscillators also indicate a conservative stance. In terms of the RSI indicator, it is trading close to the value of 46.91, which indicates that buying pressure is lower than it was during previous phases.
In terms of the MACD, the indicator reflects a bearish trend since the MACD line (4,642) is lower than the signal line (10,608). In addition, the histogram has become negative (-5,965), indicating that selling has gained momentum.
Bitcoin Faces Uncertain Market Phase
Overall, Bitcoin continues to enjoy structural strength; however, the market has entered into an uncertain period following the gains. The next trading sessions will play a vital role in helping ascertain if the prices stabilize around current levels or slowly drift towards the long-term support region.
This article contains market analysis and price predictions. These are not guarantees. Crypto markets are volatile. Always DYOR. Not financial advice.
Also Read | Arbitrum (ARB) Targets Breakout Toward $0.26 as Bullish Momentum Builds
Be the first to comment