


What to know:
- THETA holds near $0.175 as sentiment turns mildly bullish in the crypto market.
- THETA tests resistance in a descending channel, with a breakout target near $0.37.
- RSI at 55.84 shows rising buying pressure and improving bullish momentum.

Theta Network (THETA) is moving in neutral to bullish price action, as the general trend in the crypto market is turning slightly bullish. According to CoinMarketCap, the THETA price has remained stable over the last 24 hours and over the last week.
At the time of writing, THETA is trading at $0.1756, with a trading volume of $16.08 million, which has declined by 50.98% over the last 24 hours. However, its market capitalization stands at $175.61 million, which is stable.


Source: CoinMarketCap

Also Read: Theta Network Price Surge: Could THETA Hit $1.04 Soon?
THETA Break Above Channel Could Trigger $0.37 Rally
Furthermore, the crypto analyst Clifton Fx pointed out that THETA is currently testing a crucial resistance area as it trades within a descending channel on the daily timeframe.
The price structure has been marked by consistent lower highs and lower lows, but recent action shows bullish pressure building against the upper boundary, suggesting a possible shift in short-term momentum dynamics.

Source: Clifton Fx’s X Post
A break above the declining channel in THETA with confirmation could be interpreted as a bullish reversal stage.
A break above the resistance level might prompt fast movement upwards, with some experts anticipating a rally to $0.37. In case a breakout does not materialize, the bearish trend is likely to continue.
Momentum Indicators Support Ongoing Recovery
According to TradingView, RSI is at 55.84, indicating a bullish movement after exiting oversold levels at the end of March.
Breaking above the signal line and beyond the 50 mark indicates that buying activity is gaining momentum. There is still a lot of upside potential left without entering overbought territory, implying that the uptrend has staying power.
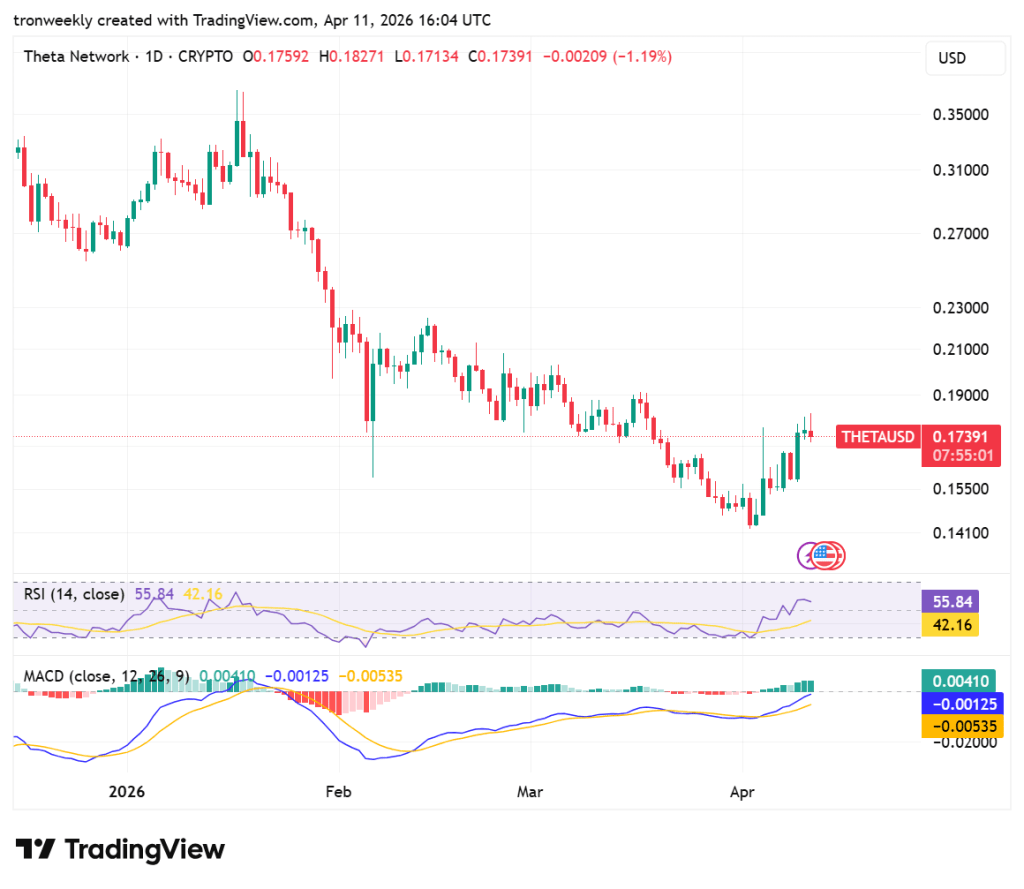
Source: TradingView
The MACD is further strengthening this rally with its bullish crossover as the blue line breaks above the orange one. The histogram is now positive and green.
Although the indicator stays below the zero line, its uptrend along with the increase in the number of green bars shows that the downtrend may finally be giving way.
This article contains market analysis and price predictions. These are not guarantees. Crypto markets are volatile. Always DYOR. Not financial advice.
Also Read: THETA Surges Toward $6: Analysts Forecast Explosive Bullish Reversal

Be the first to comment