


What to know:
- Synthetix (SNX) consolidates near $0.29, showing early signs of a potential breakout amid low volatility.
- SNX holds key descending channel support, suggesting accumulation and weakening selling pressure.
- Bollinger Bands tightening and MACD crossover signals indicate rising volatility and a possible sharp move.

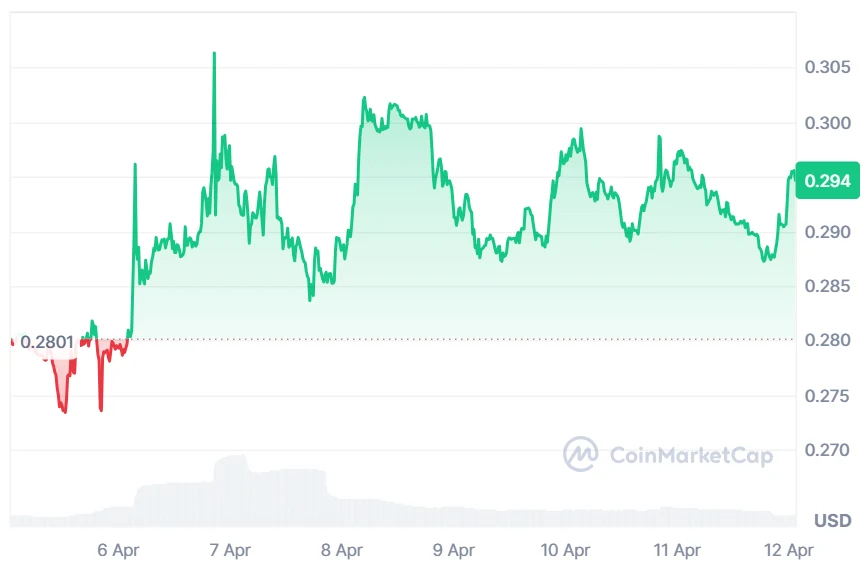
Synthetix (SNX) is moving in a consolidation phase despite the changing conditions in the crypto market. According to CoinMarketCap, the SNX price has remained stable over the last 24 hours, but it remains up by 5.39% over the last week.
At the time of writing, SNX is trading at $0.2948, with a trading volume of $6.37 million, which has dipped by 35.55% over the last 24 hours. However, its market capitalization stands at $101.51 million, which is stable.

Source: CoinMarketCap

Also Read: Synthetix (SNX) Retests Support: Path to $7.40 Possible?
Synthetix (SNX) Signals Potential Reversal Toward $5.30
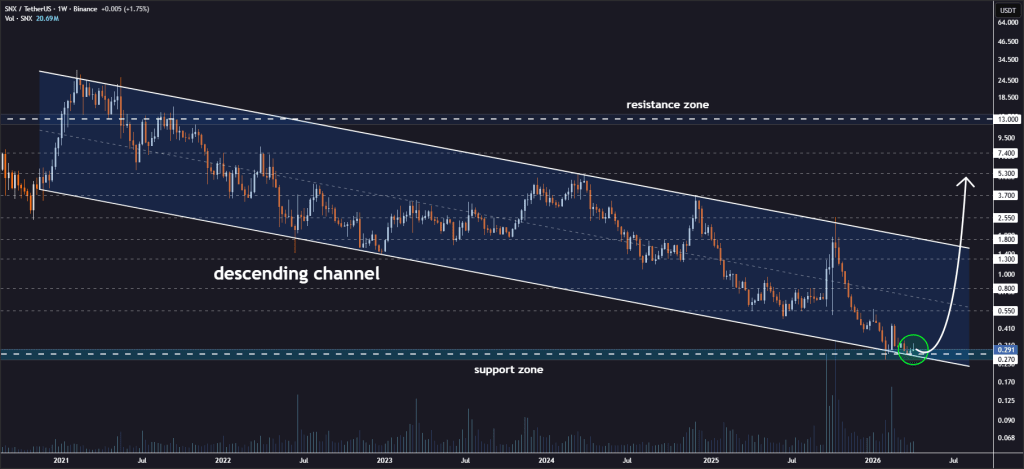
Furthermore, the crypto analyst Jonathan Carter pointed out that SNX is drawing renewed attention as it continues to defend a crucial support level on the weekly chart.
Price action shows the token holding above the lower boundary of a descending channel, a structure that has defined its trend for months and now hints at a possible shift in broader market sentiment overall.
This consistent defense of support suggests that selling pressure may be weakening while buyers gradually accumulate positions. Jonathan Carter interprets such behavior as an early sign of bullish strength building beneath the surface.
If momentum continues improving, SNX could attempt a rebound, challenging nearby resistance levels and potentially breaking out of its prolonged downward channel.
Source: Jonathan Carter’s X Post
The traders are focusing on the key targets that can determine the future course of the price movement. The first resistance is seen at $0.55, followed by resistances at $0.80, $1.30, $1.80, $2.55, $3.70, and $5.30. It should be noted that the importance of the volume analysis cannot be underestimated.
Technical Indicators Reveal a Cautious Optimism
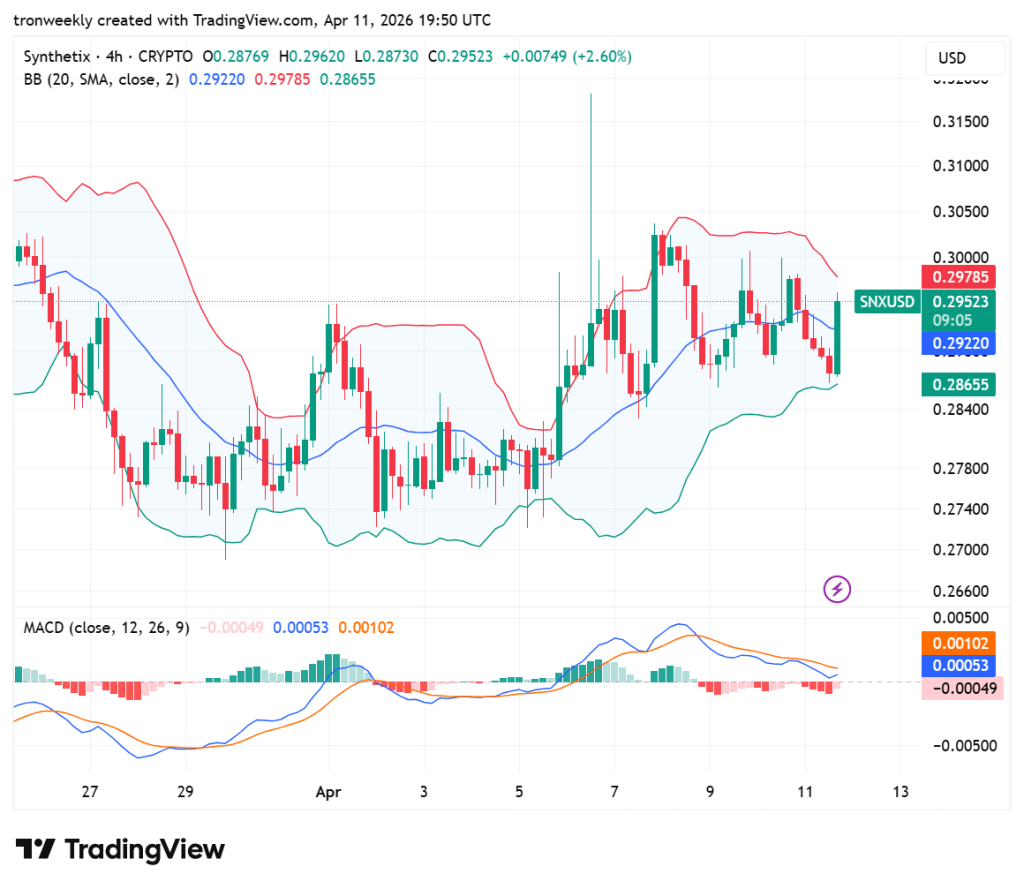
According to TradingView, SNX is stepping into a tight pattern, where its price is oscillating within a tight range of Bollinger bands.
The coin is currently trading around $0.2952, trading slightly above the 20-day moving average. While there was a quick spike towards $0.3200, the move didn’t last long as it quickly fell flat to a period of low volatility.
Source: TradingView
The MACD indicator suggests that there is a bearish turn in momentum. The MACD line is below the signal line, which means that the oscillator is in the negative area, while the histogram shows an uptrend.
These factors indicate that despite the current stability in price levels, there is increasing pressure from sellers on the market.
This article contains market analysis and price predictions. These are not guarantees. Crypto markets are volatile. Always DYOR. Not financial advice.
Also Read: Synthetix (SNX) Jumps 5.7%: Is a 40% Breakout to $0.44 Next?

Be the first to comment