


What to know:
- Ethereum’s 50-day and 200-day moving average “death cross” is forming, historically signaling late-stage bear market bottoms.
- Analysts suggest ETH may be only 2%–3% away from completing its full corrective phase if the bottom is not already in.
- Price continues to face resistance near $2,300, while $2,150 remains a key support level to watch for trend direction.

Ethereum might be approaching a significant turning point due to a variety of technical factors aligning themselves, even with the current weakness in the price. There is now a formation of what is called a “death cross,” which, historically, has been seen around the last stages of a bear market cycle.
Ethereum Trend Shift Nears Bottom
A crypto analyst, Sykodelic,expressed his pessimistic view regarding the possible scenario for Ethereum in case it had not established itself at the bottom already. In this case, the crypto coin could be just about 2% to 3% from completing the entire downward corrective phase.


Source: Sykodelic’s X Post

In terms of previous market cycles, the Ethereum 3-day death cross is frequently seen to coincide with previous significant bottoms or to be formed before them. In nearly all previous instances, the price made its bottom at or immediately following the formation of this cross.
The Death Cross is characterized by the event where the 50-day moving average crosses under the 200-day moving average. Although it is normally viewed as a bearish indicator, it may be used to identify the end of sell-off pressure and the possible entry of long-term buyers.
If history repeats itself, then Ethereum may make its last bottom about 54 days from the death cross event, indicating that the potential turning point will come around April 28th. In accordance with previous activity, an extended period of bearish action from this point will be unlikely to occur unless circumstances change dramatically.
Also Read | Ethereum E-GDP Hits $563B Despite 34% Price Drop in Q1
Ethereum Faces Rejection at $2,300
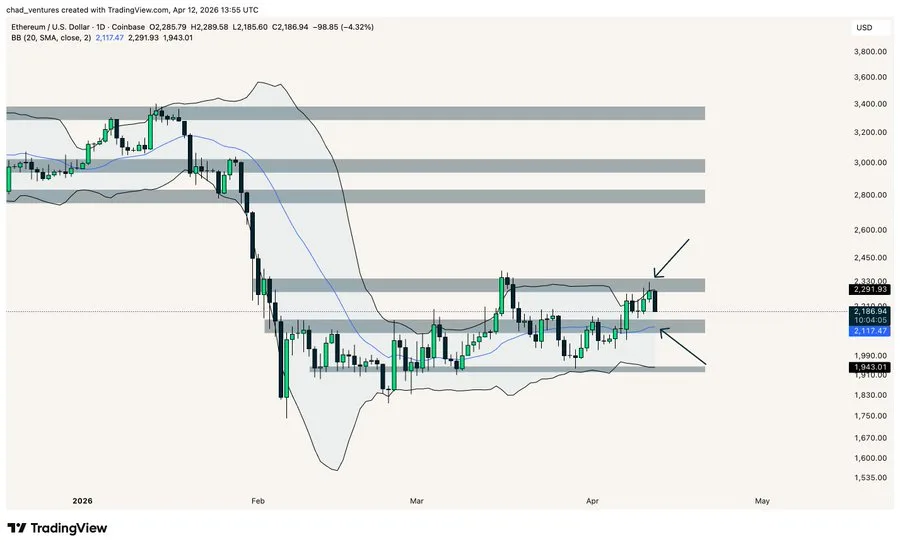
Another analyst, Chad, pointed out that Ethereum continues to struggle against breaking out above the resistance zone at $2,300 and the upper Bollinger Band on the daily chart. Every breakout attempt has failed so far, meaning the bullish momentum isn’t strong enough yet.

Source: Chad’s X Post
Market structure is stable for the time being, with important price levels holding their ground. The inability of the market to return above $2,300 indicates that ETH is currently trading in a range-bound fashion.
Unfortunately, on the negative side, it is vital to monitor the important level at $2,150, where we will meet horizontal support and the 20-day SMA. If this level falls below the price action, then we can assume that the further downtrend will continue. However, if the price manages to hold above this level, then stability will be ensured for Ethereum.

Source: TradingView
This article contains market analysis and price predictions. These are not guarantees. Crypto markets are volatile. Always DYOR. Not financial advice.
Also Read | Bitcoin Shows Strong Setup: Is a 10% Rally Toward $80K Next?

Be the first to comment