


What to know:
- ADA hovers near the $0.243 pivot as traders watch for a breakout or deeper downside risk.
- Volume rises 24% while open interest falls, signaling mixed sentiment in derivatives.
- RSI at 43.72 and MACD near crossover show weak momentum and no clear trend shift.

Cardano (ADA) trades near a decisive level on April 15, 2026, as price action tightens around key support. Market focus remains on whether buyers can defend this zone or if continued pressure will push the asset into a deeper correction phase.
As per data from CoinMarketCap, ADA is trading at $0.2403 and marked a 24-hour dip of 0.11%. Trading volume increased 24.24%, reaching $592.19 million, reflecting greater activity. Market capitalization stands at $8.67 billion, and the token has fallen 9.22% in a month.
Also Read: Cardano (ADA) Below $0.266: Will It Break or Drop Toward $0.23?

ADA Holds Key Support With $0.30 in Focus
Ali Martinez, a crypto analyst, highlighted that ADA is back at the important level of $0.243. Previous cycles have used that zone as a major pivot. It also led to bounces when buyers defended it successfully.
If that support holds, ADA will have an opportunity to move towards the resistance at $0.30. This level is the next visible upside objective. A continued bounce could bring back short-term market confidence.


A daily close below $0.243, however, would indicate structural weakness. If this happens, it puts further downside pressure across the chart. If that is the case, ADA could drop towards lower prices at around $0.10.
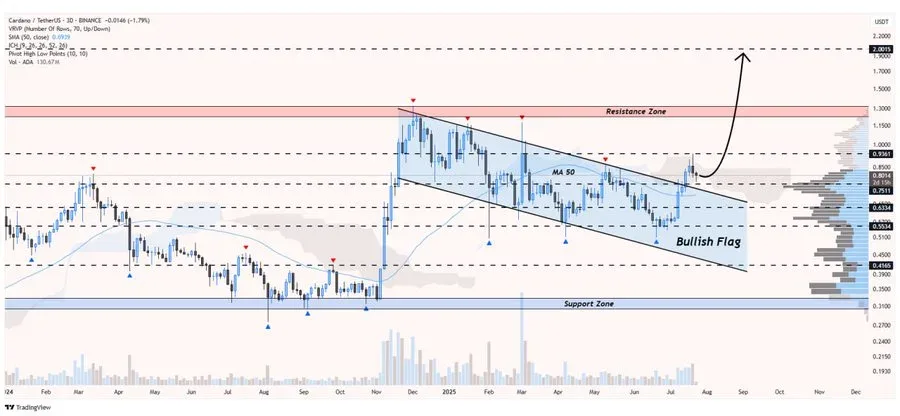
Additionally, another analyst, Whales Crypto Trading, also mentioned a breakout from a bullish flag setup on the 3-day chart. This setup is indicative of a continuation structure. This would put a long-term target of the pattern at close to $2.00.

ADA Derivatives Mixed as Volume Rises, OI Falls
CoinGlass data shows a mixed outlook. The derivatives volume surged by 29.11% to $748.73 million, indicating increased activity within the market. However, open interest fell by 4.59% to $419.78 million, signifying the closure of positions.
The OI-weighted funding rate is recorded at 0.0053%. This figure indicates a small positivity among traders. It suggests long positions still have a slight edge.
RSI and MACD Signal Weak Momentum
According to TradingView data, the Relative Strength Index (RSI) is 43.72, and the moving average RSI is 45.63. These values put ADA under neutral conditions. Weak momentum continues, there is no strong indication of buying pressure.
The MACD (Moving Average Convergence Divergence) states that the MACD line is currently at -0.0044 and the signal line is at -0.0045. The histogram sits at 0.0001. The gap is small, indicating waning bearish momentum but not yet a clear bullish cross.
ADA sitting at a significant technical zone. The next trend direction remains defined by the price reaction around $0.243. Traders are still watching this level closely for confirmation signals.
This article contains market analysis and price predictions. These are not guarantees. Crypto markets are volatile. Always DYOR. Not financial advice.
Also Read: SEI Holds Descending Channel Support as Analysts Eye $0.10 Break

Be the first to comment