

What to know:
- Solana (SOL) surged over 4% after breaking the consolidation resistance zone breakout.
- Technical indicators show mixed signals: RSI around 54, mild MACD crossover forming.
- Solana market enters transition phase with upside potential but unconfirmed trend continuation.

Solana (SOL) surged by over 4%, following its breakout from a consolidation period, with analysts attributing the gains to signals indicating a recovery in the near term. While investors have taken note of the possible change in trend direction, the sustainability of the rally is yet to be confirmed.
At the time of writing, Solana is trading at $87.33, recording a 5.01% gain over the last 24 hours. The SOL has also seen strong market activity, with daily trading volume reaching approximately $7.68 billion and a market capitalization of $50 billion, according to CoinMarketCap data.
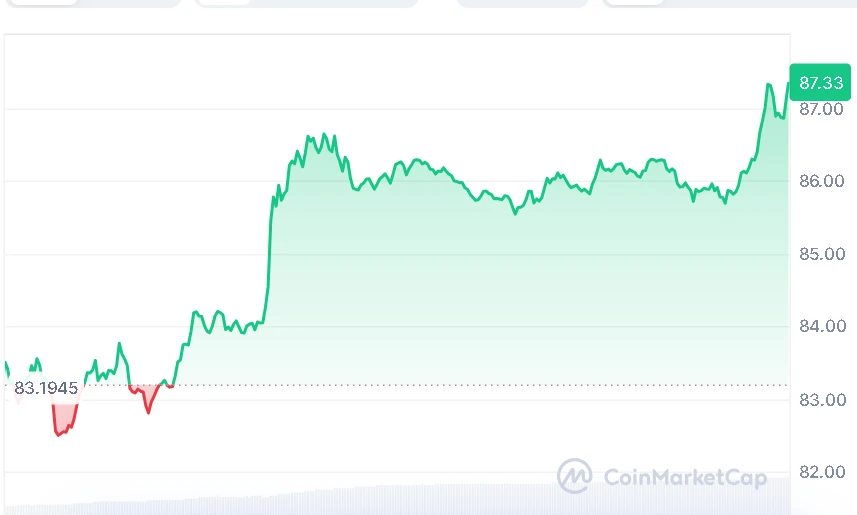

Source: CoinMarketCap

Also Read | Zcash (ZEC) Builds Bullish Structure as Traders Eye $450 Resistance Target
Solana Stabilizes Above Breakout
As per the analysis of a crypto analyst, BitGuru posted on X on April 14, 2026, SOL seems to be emerging from its consolidation stage and is starting to form an upward formation. According to BitGuru, the price is staying above the breakout area, indicating that the buyers are in charge.


Source: BitGuru’s X Post
This is an indication that Solana is beginning to gain strength under the resistance area. In case strength continues, the prices can continue moving upwards in the subsequent periods. It is at a preliminary stage, and the confirmation will come later.
While the price rise has happened recently, the technical outlook shows that the general direction remains quite weak. SOL is currently trading just below short-term support around $86-$87, which indicates stability at present but no bullish momentum in the markets.
Solana Momentum Shows Mixed Signals
The Relative Strength Index (RSI) stands at 54, which is slightly above 50, suggesting strong buying interest but not overbought. SOL is trading close to its 50-day moving average at roughly $85 but lower than its 100-day and 200-day moving averages, at $98 and $129, respectively.
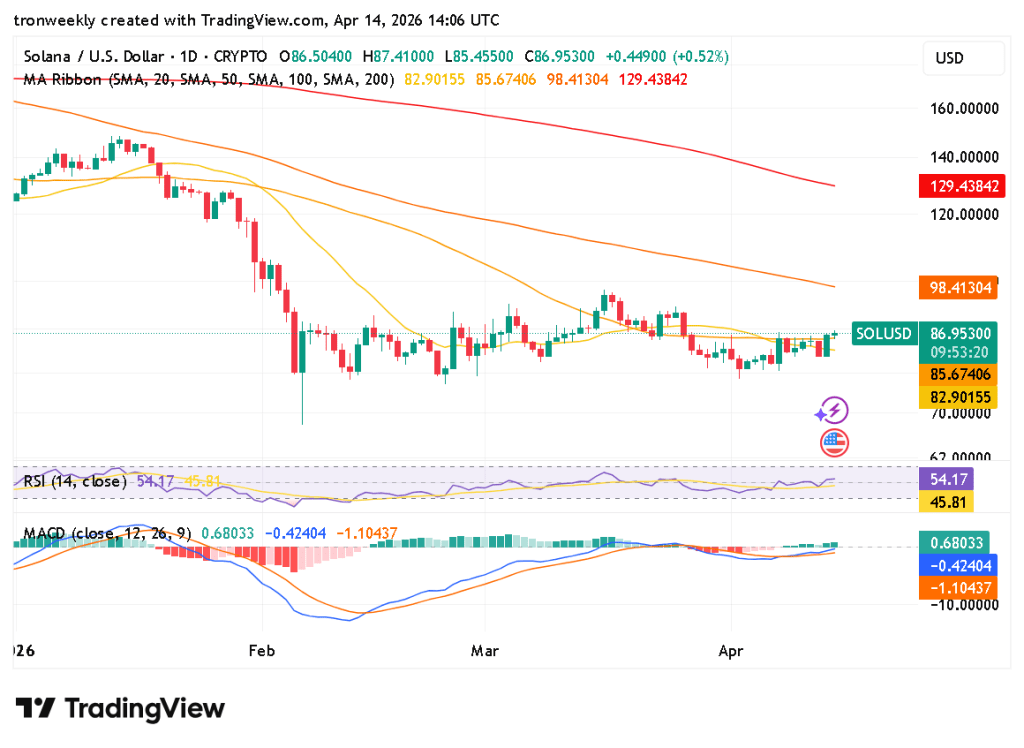
Source: TradingView
Mixed signals on momentum. Recently, the MACD has been giving a slightly positive crossover signal (line crosses above the signal line), showing that momentum might be growing. However, the histogram remains below zero, meaning that upward momentum is not very solid.
Solana Market Enters Transition Phase
Overall, Solana looks set to recover from its breakout, although the trend itself has yet to show clear bullish signals. The market seems to be undergoing a transition period where there is still upside potential, though this can only be confirmed if buying continues and the price manages to break resistance areas.
This article contains market analysis and price predictions. These are not guarantees. Crypto markets are volatile. Always DYOR. Not financial advice.
Also Read | XRP at $1.34: Whale Accumulation Sparks Optimism for a Potential Breakout

Be the first to comment