


What to know:
- TIA breaks the $0.28–$0.34 range, moving from consolidation into a strong uptrend phase.
- RSI rises to 67 with MACD bullish crossover, showing increasing momentum and buyer strength.
- Next resistance targets are set at $0.41 and $0.70, as traders watch for breakout confirmation or pullback.

Celestia (TIA) is moving in a positive price trajectory as the token has broken above the trendline resistance, which has capped the momentum many times. According to CoinMarketCap, the TIA price has surged by 14.55% over the last 24 hours and 24.01% over the last week.
At the time of writing, TIA is trading at $0.3700, with a trading volume of $82.42 million, which has surged significantly by 262.17% over the last 24 hours. However, its market capitalization stands at $335.25 million, which is also up by 14.68%.


Source: CoinMarketCap

Also Read: Celestia (TIA) Shows Early Signs of Breakout With a $1.2 Recovery in Sight
TIA Breakout Signals Potential Reversal Toward $0.70
Furthermore, the crypto analyst World Of Charts pointed out that TIA has recently broken above a long-standing descending trendline that had been guiding its broader downtrend for weeks.
This breakout signals a potential shift in market structure as selling pressure weakens and buyers begin to regain control. Traders are now watching for confirmation through sustained strength and increasing volume.

Source: World Of Charts’ X Post
With momentum now better, the next key level to aim for would be the $0.70 area, which is also consistent with a possible bounce area considering previous resistance levels.
Yet there is always some element of risk since there is the possibility that fake breakouts might happen if the buying interest starts to weaken.
Momentum Indicators Support Ongoing Recovery
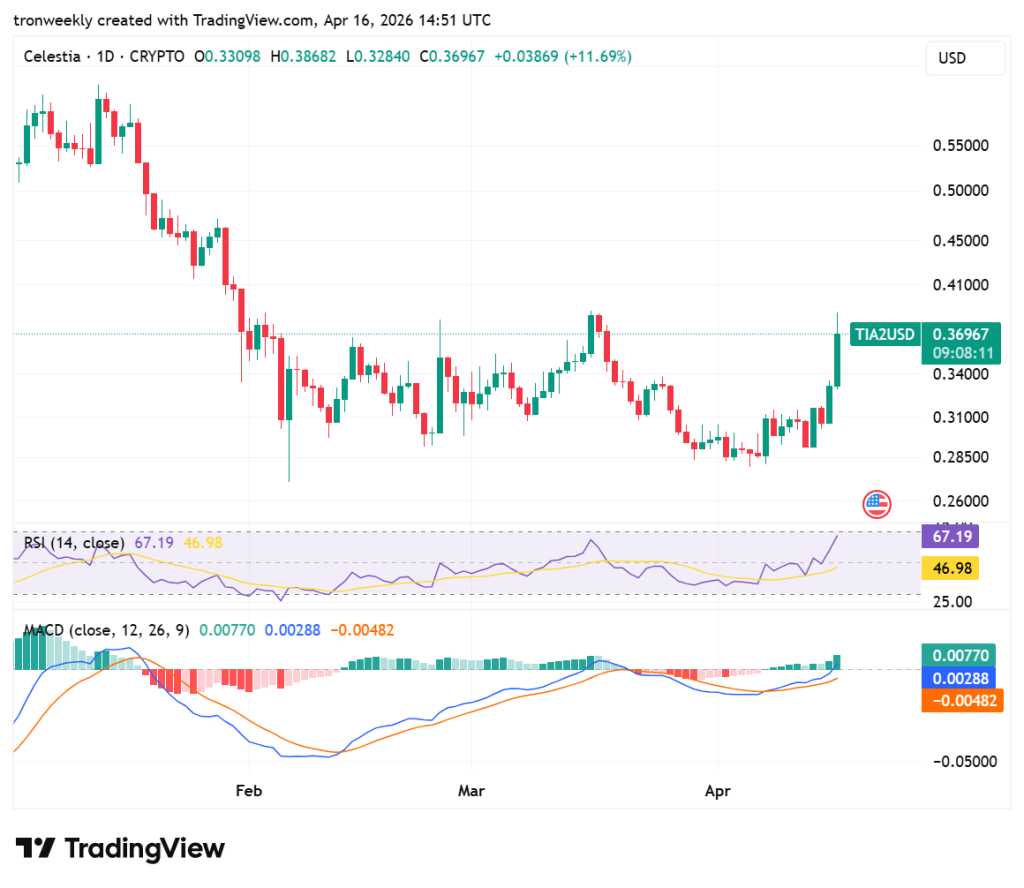
According to TradingView, TIA has experienced a definitive bullish breakout following a protracted period of consolidation at levels of $0.28 to $0.34.
This breakout is triggered by a huge green candle that took the asset to $0.369, resulting in a daily gain of 11.69%. With this breakout, TIA has shifted its momentum from a neutral accumulation phase to an aggressive one.
Source: TradingView
The technical indicators support this positive momentum. In particular, the RSI has increased to 67.19, approaching overbought levels, whereas the MACD shows that there is a bullish crossover, accompanied by growing green bars on the histogram.
This situation implies a high probability that buying pressure is dominating the market at the moment, but its fast growth implies possible resistance at $0.41.
This article contains market analysis and price predictions. These are not guarantees. Crypto markets are volatile. Always DYOR. Not financial advice.
Also Read: Celestia (TIA) Holds Critical $0.20 Level, Targets $0.63 Breakout

Be the first to comment