


What to know:
- ARB trading volume surges 64% to $186M, signaling rising investor interest in ARB’s breakout rally.
- MACD strengthens upward momentum while RSI enters the overbought zone, suggesting short-term consolidation ahead.
- Analysts say ARB may be entering early altcoin recovery, with upside targets toward $0.15–$0.26.

Arbitrum (ARB) is moving in a bullish price trajectory as the BTC price has stabilized above $74K, which has boosted the overall market. According to CoinMarketCap, the ARB price has surged by 10.07% over the last 24 hours and 20.08% over the last week.
At the time of writing, ARB is trading at $0.1275, with a trading volume of $186.85 million, which has surged by 64.32% over the last 24 hours. However, its market capitalization stands at $770.8 million, which has also surged by 10.07%.

Source: CoinMarketCap

Also Read: Arbitrum (ARB) Targets Breakout Toward $0.26 as Bullish Momentum Builds
Arbitrum (ARB) Eyes Rally as Altcoin Cycle Returns
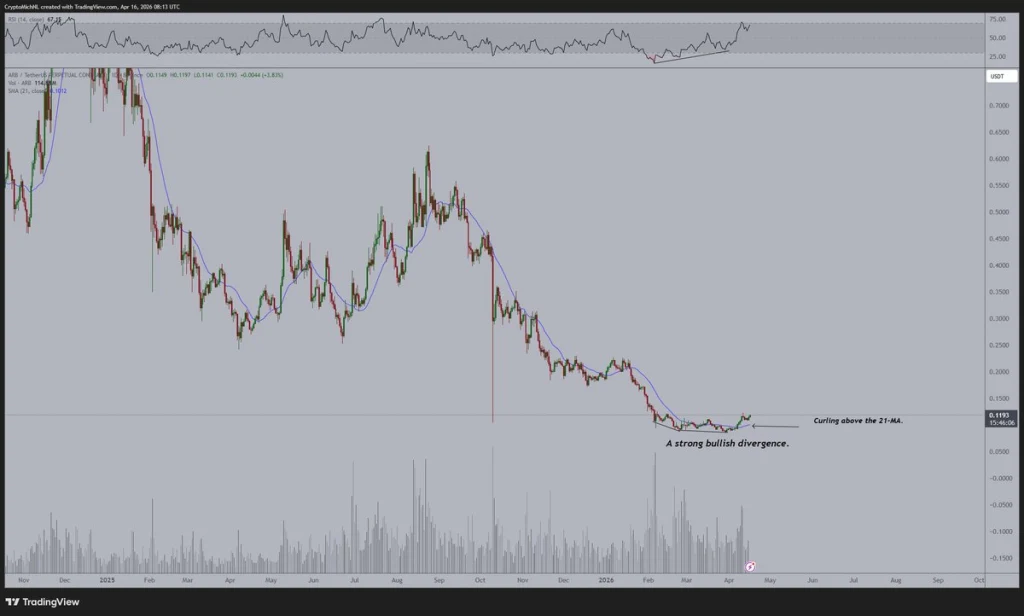
Furthermore, the crypto analyst Michael van de Poppe highlighted that ARB is showing early signs of a potential trend reversal as it displays bullish divergence on the daily timeframe alongside a decisive break above the 21-day moving average.
This technical shift suggests weakening downside pressure, while rising volume indicates renewed market participation. Similar setups previously aligned with early cycle recovery phases across altcoins.
The collapse of ARB and other cryptocurrencies in quarter 4, 2025, seems to herald a move into the phase where cryptocurrency markets generally spend two to four months building a solid foundation.
What is striking about the breakout from the short-term trend line is that ARB represents the first such breakout since summer 2025.
Source: Michael van de Poppe’s X Post
Bitcoin has been consolidating for about two and a half months, similar to past consolidation bases before expansion.
After the completion of these stages, there are usually breakout trends that last from two to four months, resulting in robust upward movements. In past instances, these moves have resulted in returns between 150% and 400% from bottom levels.
Momentum Indicators Support Bullish Reversal Ahead
According to TradingView, ARB shows clear signs of a recovery from the $0.083 support level. After a spell of relatively quiet trading, the asset rose more than 10%, hitting the $0.127 mark.
The breakout indicates a change in trader sentiment, moving from negative to positive, with further upside potential on the radar.

Source: TradingView
The technical indicators indicate that there is momentum towards higher prices but imply that traders should exercise some prudence.
The MACD histogram is signaling positive momentum because of the divergence between the two signal lines, while the RSI is now at the value of 72.05, thus putting it above its oversold status.
This article contains market analysis and price predictions. These are not guarantees. Crypto markets are volatile. Always DYOR. Not financial advice.
Also Read: Arbitrum (ARB) Forms Bullish Patterns: Can It Hit $0.150 Next?

Be the first to comment