


What to know:
- Ethereum (ETH) is gaining bullish momentum, rising over 7% as overall crypto market sentiment improves.
- The $2,350–$2,400 resistance zone remains a key barrier, with a breakout needed to confirm a sustained upward trend.
- A rejection at resistance could push ETH below the $2,200 support level, increasing short-term downside risk.

Ethereum (ETH) is moving in a neutral to bullish price setup as the conditions in the crypto market have turned bullish. According to CoinMarketCap, as of Friday, April 17, the ETH price has surged by 1.21% over the last 24 hours and 7.66% over the last week.
At the time of writing, ETH is trading at $2,360.10, with a trading volume of $20.79 billion, which has surged by 20.5% over the last 24 hours. However, its market capitalization stands at $284.88 billion, which is also up by 1.2%.

Source: CoinMarketCap

Also Read: Ethereum (ETH) Foundation Flags 100 Suspected North Korean Operatives in Web3
Ethereum Could Surge Above $2400 to Confirm Reversal
Furthermore, the crypto analyst Ted highlighted that Ethereum is facing strong resistance between $2,350 and $2,400, failing multiple times to break above this critical range. Weak spot ETF inflows are limiting momentum, signaling a lack of institutional demand.
Without stronger buying pressure, ETH remains stuck below resistance, reflecting cautious market sentiment and uncertainty among traders awaiting clearer bullish confirmation signals.
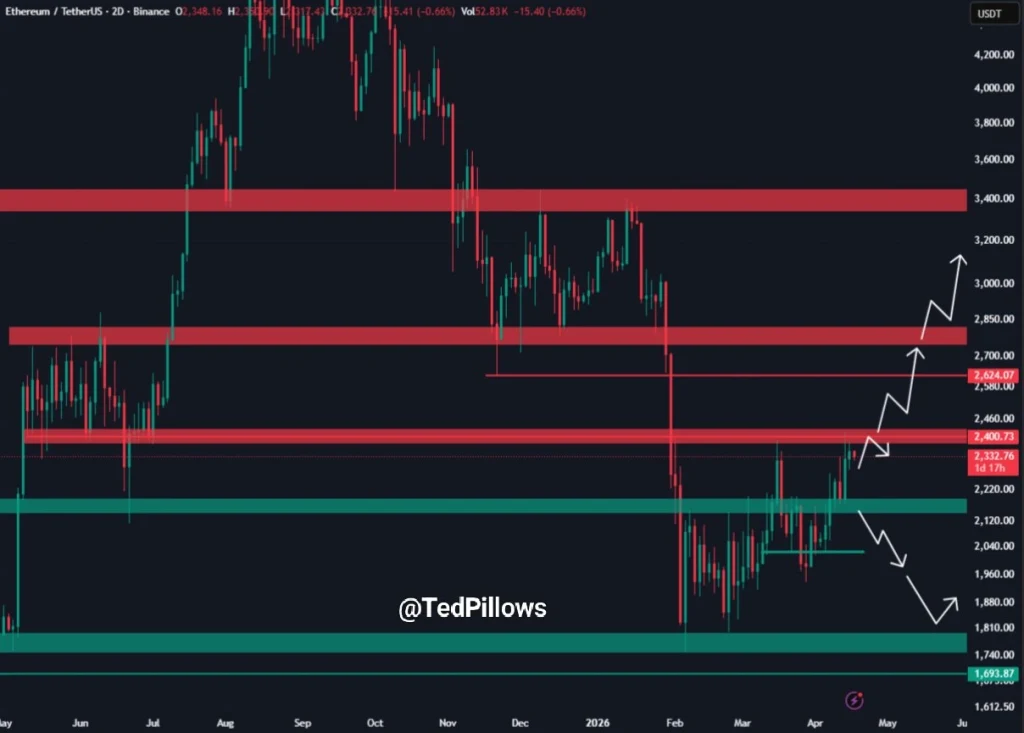

Source: Ted’s X Post
However, if ETH fails to stabilize at the current level, risks are likely to become higher. Failure to return above the $2,350-$2,400 range could result in a pullback, sending the price lower towards the $2,200 support line. This development could be unfavorable to bulls, encouraging sellers to take positions.
ETH Technical Outlook Supports Bullish Potential Ahead
According to TradingView, the Ethereum coin is experiencing recovery from its lowest point in January, and it is currently trading at a level close to $2,353.
The positive movement can be seen from the fact that the price has moved towards the upper Bollinger Band and is above the resistance level of $2,187. The next major resistance is expected at $2,428.

Source: TradingView
Technical indicators favor this trend. The RSI value of 61.60 indicates buying activity but not yet being overbought, implying more upside potential.
On the other hand, the MACD has a bullish crossover with a positive histogram, proving that strength is sustained in the near term. Collectively, these indicate that bulls will continue their attempt to gain back lost ground.
This article contains market analysis and price predictions. These are not guarantees. Crypto markets are volatile. Always DYOR. Not financial advice.
Also Read: Ethereum Rebounds From Key Support as Resistance Near $3,035 Caps Upside

Be the first to comment