


What to know:
- SEI consolidates near $0.05892 as the market stabilizes after volatility, signaling a potential buildup for the next move.
- Bullish signs emerge as SEI breaks a falling wedge on the daily chart, showing weakening selling pressure.
- Analysts highlight a potential $0.12 upside target if bullish momentum and breakout structure hold.

Sei (SEI) is moving in a consolidation phase with the bullish reversal in sight after breaking the upper boundary of the falling wedge pattern. According to CoinMarketCap, the SEI price has remained stable over the last 24 hours, but it has surged by 3.86% over the last week.
At the time of writing, SEI is trading at $0.05892, with a trading volume of $42.39 million, which has surged by 13.49% over the last 24 hours. However, its market capitalization stands at $411.1 million, which is stable.


Source: CoinMarketCap

Also Read: SEI Sees Modest April Bounce: Can Price Climb 10% from Recent Lows?
SEI Breaks Falling Wedge on Daily Chart, Eyes $0.12
Furthermore, the crypto analyst ZAYK Charts pointed out that SEI is showing a potential bullish reversal after breaking out of a falling wedge pattern on the 1D timeframe.
This technical setup often signals weakening selling pressure and a shift in momentum toward buyers. The breakout suggests growing strength in price action, attracting attention from traders watching for trend continuation.

Source: ZAYK Charts’ X Post
As far as momentum continues, SEI is expected to continue recovering towards the $0.12 price target, which fits into the old levels of resistance.
However, validation needs to come from the volume and support above the breakaway level. Otherwise, failure at maintaining this pattern will see a reversal back to the wedge.
Technical Indicators Support Ongoing Bullish Trend
According to TradingView, SEI shows a bullish reversal as the price climbs toward $0.05915. After consolidating near $0.05050, it successfully breached the 200-period EMA at $0.05831.
This breakout transforms a long-term resistance into potential support, while the shorter-term moving averages slope upward, confirming that the current market sentiment has shifted firmly toward the buyers.
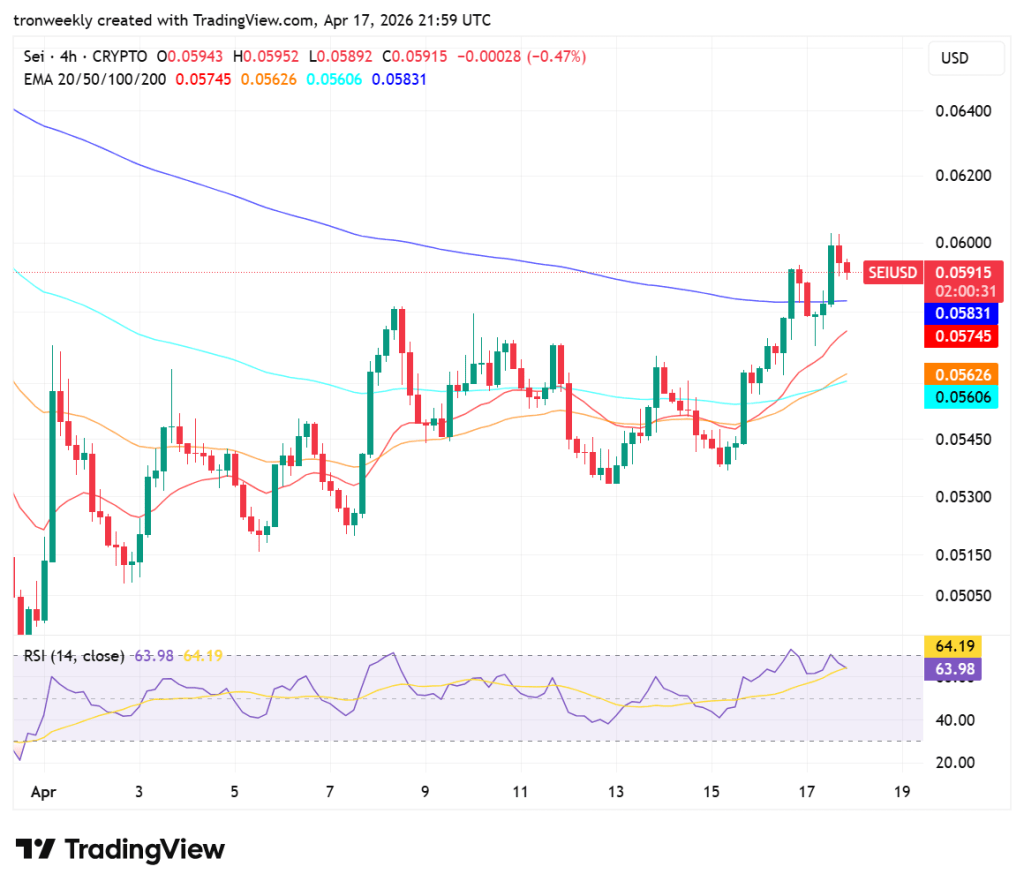
Source: TradingView
The RSI indicator currently stands at 63.98, indicating positive momentum without entering overbought levels.
Although the latest candles indicate bearish action at around $0.06000, the absence of bearish divergence suggests stability in the trend. In order for the asset to continue gaining value, the price needs to remain above the 200EMA line.
This article contains market analysis and price predictions. These are not guarantees. Crypto markets are volatile. Always DYOR. Not financial advice.
Also Read: SEI Holds Descending Channel Support as Analysts Eye $0.10 Break

Be the first to comment