

What to know:
- HYPE is consolidating after a rally toward $46 resistance, now trading near $43.57 amid short-term weakness
- A triple top on the 4H chart suggests weakening bullish momentum, with neckline support now critical
- The price remains above key EMAs (20, 50, 100, 200), keeping the bullish structure intact

Hyperliquid (HYPE) is moving in a consolidation phase after the recent rally that has pushed the price near $46. According to CoinMarketCap, the HYPE price has declined by 1.86% over the last 24 hours, but it remains up by 7.61% over the last week.
At the time of writing, the token is trading at $43.57, with a trading volume of $180.48 million, which has declined by 29.05% over the last 24 hours. However, its market capitalization stands at $11.13 billion, which is also down by 1.87%.
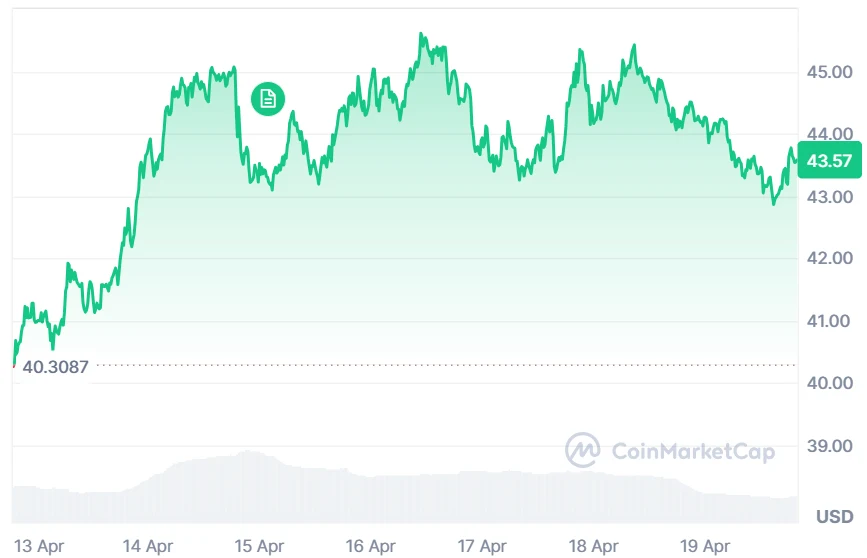

Source: CoinMarketCap

Also Read: Hyperliquid (HYPE) Gains Strength: 3 Key Signals Target $50 Surge
HYPE Faces Neckline Test After Triple Top Formation
Furthermore, the crypto analyst Aplha Crypto Signal highlighted that the token is showing a clear triple top formation on the 4H chart, signaling weakening bullish momentum after repeated rejections at the same resistance zone.
The price is now testing the neckline, a critical support level. A breakdown below it would confirm bearish continuation and suggest sellers are gaining short-term control in the market structure phase outlook.

Source: Alpha Crypto Signal’s X Post
Assuming that the neckline breaks out, then HYPE may fall even more quickly because liquidity is being squeezed below the support line.
There is talk of placing limit longs in the lower grey area because there was previously strong demand at those levels. The technical structure will remain bearish unless there is recovery of resistance levels.
Technical Indicators Show Ongoing Bullish Potential
According to TradingView, the bullish rally is very strong for HYPE, and the price has been hitting new highs and making new lows at all times.
HYPE has traded strongly above its 20-day, 50-day, 100-day, and 200-day EMA, and this has ensured that the momentum remains strong to the upside. The token is currently testing the $46 level of resistance.

Source: TradingView
MACD is further confirming the bullish sentiment, with the MACD line being located above the signal line. Although the histogram is showing some weakness due to shrinking green bars, which indicates a temporary consolidation and not a reversal, there is still solid momentum. Investors will be watching this area to see how long this trend lasts.
This article contains market analysis and price predictions. These are not guarantees. Crypto markets are volatile. Always DYOR. Not financial advice.
Also Read: HYPE Price Prediction: Will Consolidation Above $42 Lead to $50 Target?

Be the first to comment