


What to know:
- DOT forms a cup and handle pattern, signaling a potential breakout, with a $1.50 target if confirmed.
- RSI at 47.63 and MACD indicate neutral momentum, with no strong buying or selling pressure.
- DOT is trading in a tight range as traders wait for a clear breakout before entering positions.

Polkadot (DOT) is moving in a consolidation phase despite the bullish conditions in the crypto market. According to CoinMarketCap, the DOT price has remained stable over the last 24 hours, but on the weekly timeframe, it remains up by 9.23%.
At the time of writing, DOT is trading at $1.27, with a trading volume of $165.96 million, which has declined by 6.37% over the last 24 hours. However, its market capitalization stands at $2.13 billion, which is stable.

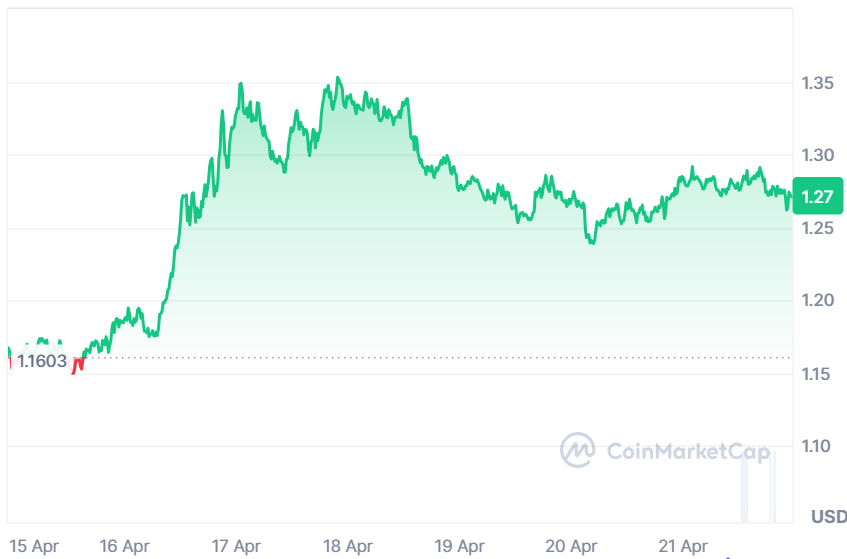
Source: CoinMarketCap

Also Read: Polkadot Drops From $10.50 to $1.18: Can DOT Recover After Losing Key Support?
DOT Cup and Handle Signals Bullish Breakout
Furthermore, the crypto analyst Alpha Crypto Signal highlighted that DOT is showing a developing cup and handle pattern on its chart, a structure often associated with bullish continuation.
The rounded base reflects gradual accumulation after selling pressure fades, while the current sideways movement forms the handle. This phase suggests consolidation as the market prepares for its next decisive move.
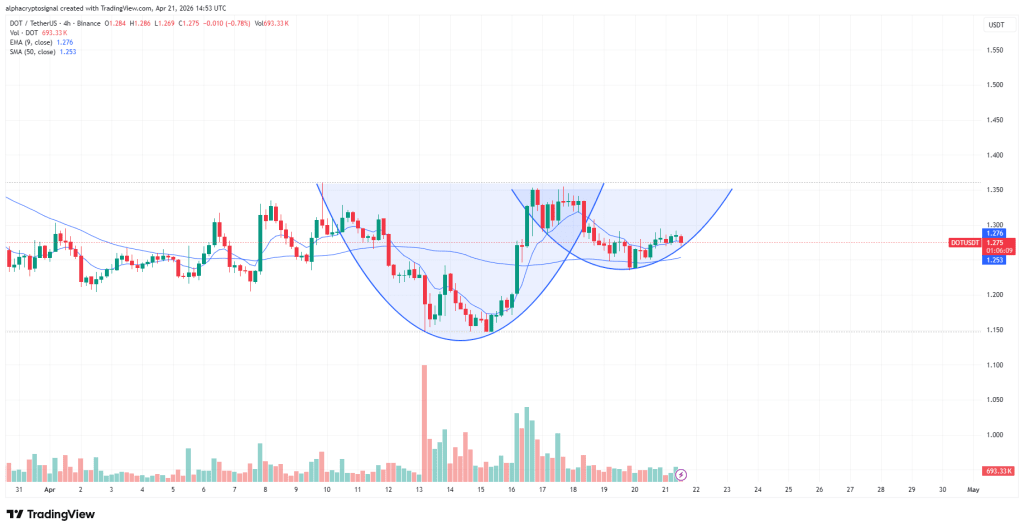
Source: Alpha Crypto Signal’s X Post
A breakout above the resistance level on the handle would confirm the formation and create a fresh burst of bullish momentum.
If it occurs with good volume, the bulls may look for levels of $1.50 as their price targets. Until that happens, the range-trading in DOT persists, and patience is better than rashness.
Momentum Indicators Point to Neutral Outlook
According to TradingView, the RSI stands at 47.63, indicating that there is balance in the market, as neither buyers nor sellers are dominating it.
The RSI indicator has remained close to the middle of its range, suggesting that DOT is neither overbought nor oversold. Since there is no bias in any direction, investors are waiting for an incentive to take any action.

Source: TradingView
The MACD is hinting that there is not much momentum, as the signal line is only slowly diverging from the MACD line. Sitting slightly above zero, the light-colored histogram bars indicate a consolidation period.
The tight hug between the two lines suggests that there is little volatility, which means that the asset does not have enough momentum for any direction.
This article contains market analysis and price predictions. These are not guarantees. Crypto markets are volatile. Always DYOR. Not financial advice.
Also Read: Polkadot (DOT) Price Consolidates: Is a Strong Breakout to $3.40 Imminent?

Be the first to comment