


What to know:
- Litecoin is consolidating near $55 with a breakout likely imminent.
- Analysts point to upside targets at $70 and potentially above $100.
- A drop below $52 could invalidate the bullish setup and trigger losses.

Litecoin (LTC) is currently trading at $55.27 on Wednesday, April 22, 2026, showing a marginal 0.2% gain as the asset continues to consolidate within a narrowing technical structure.
CoinMarketCap data indicates subdued activity, with 24-hour trading volume at $249.37 million, down 2.15%, while weekly performance remains slightly positive at 1.47%.
The cryptocurrency is currently positioned at a key technical threshold between $55 and $56, where price compression suggests that volatility is tightening ahead of a potential directional move.


Traders are closely monitoring this zone as Litecoin approaches the apex of a multi-week consolidation pattern that could determine its next major trend.
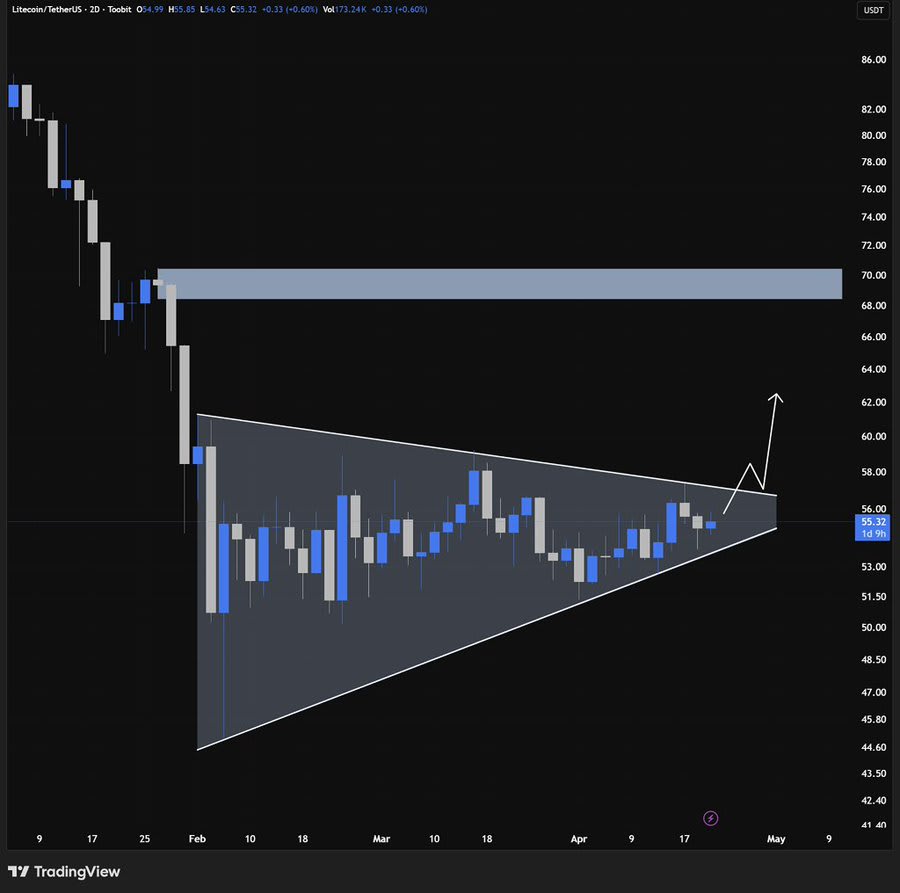
Litecoin Forms Symmetrical Triangle Pattern
Crypto analyst Trader Symba noted that Litecoin is forming a symmetrical triangle on the two-day chart, a structure often associated with volatility contraction before a sharp breakout.
The pattern reflects higher lows meeting lower highs, suggesting that both buying and selling pressure are converging toward a critical point. The current setup shows buyers gradually stepping in at higher levels while sellers continue to defend resistance near $56–$58.
This compression is often described as a “spring-loading” phase, where price energy builds before expansion. A confirmed breakout above $58 could open the door toward $60–$62, followed by a stronger resistance zone between $68 and $70.
However, failure to hold current support could push LTC back toward $52 or $50. A breakdown below that level would weaken the structure further, exposing downside targets near $48–$45.

Also Read | Litecoin Surges 14% as ETF Buzz, Market Momentum Push LTC Toward $140
Market Activity Signals Strong Price Interest
Crypto analyst Whales_Crypto_Trading suggests Litecoin may already be attempting an early breakout, supported by a strong bullish candle formation. This view outlines a broader upside scenario, with a potential long-term target near $107 if momentum continues.
The analysis highlights the importance of the 100-day moving average, which has repeatedly acted as resistance. A sustained move above this level could flip it into support, strengthening bullish momentum.
Additionally, heavy trading activity between $80 and $90 indicates a high-liquidity zone that may influence future price action. Key resistance levels are concentrated between $95 and $100, where multiple technical barriers converge.
A confirmed breakout above this range, supported by increased volume, could extend gains toward $110–$120, with further upside potential toward $135–$150 in a sustained bullish cycle.
On the downside, failure to hold support near $80 could weaken the structure and lead to declines toward $75 and $67.


This article contains market analysis and price predictions. These are not guarantees. Crypto markets are volatile. Always DYOR. Not financial advice.
Also Read | Litecoin Hits $112 Peak, Can Momentum Drive Price Toward $125 Mark?

Be the first to comment