


What to know:
- Hedera Hashgraph (HBAR) consolidates tightly as ETF speculation increases investor attention globally.
- ETF inflows and proposals strengthen expectations for potential upside toward one dollar.
- Technical indicators remain neutral, showing consolidation and a lack of confirmed directional momentum.

Hedera Hashgraph (HBAR) is trading in a narrow range of $0.089 amid considerations from organizations in a low-volatility market. With the price maintaining its range-bound pattern, the market shows more interest in the ETF talk.
At the time of writing, Hedera Hashgraph (HBAR) is trading at $0.08904 with a 24-hour trading volume of $ 130.05 million and a market capitalization of $ 3.88 billion. HBAR price decreased by 0.04% over the last 24 hours.
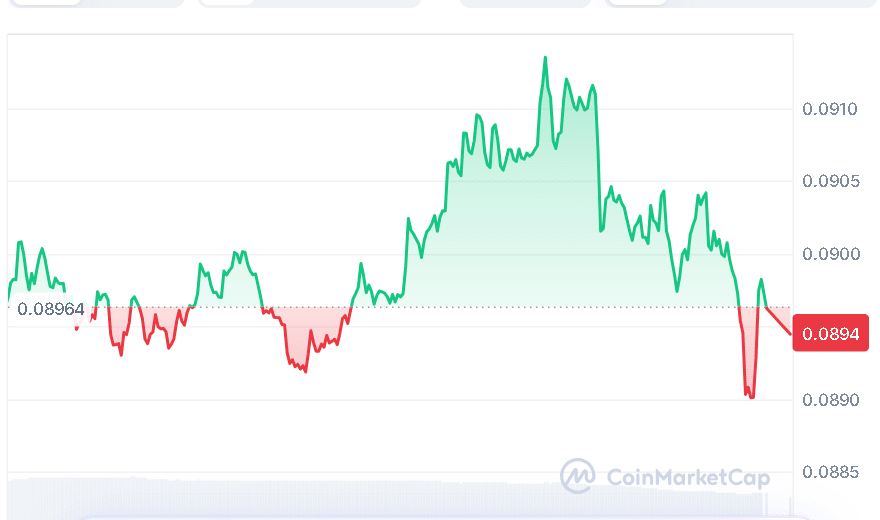

Source: CoinMarketCap

Also Read | Coinbase’s x402 Protocol Launches Promising New App Store for AI Agents
Hedera Hashgraph Accumulation Zone Builds
A prominent crypto analyst, Crypto Patel, noted that HBAR was being undervalued since investors were turning to riskier plays. Patel added that some underlying structural forces were developing under the surface but might still be unnoticed by the market.


Source: Crypto Patel’s X Post
According to Patel, HBAR has already been categorized as a commodity according to the rules set by the SEC and CFTC, thus placing it on a more stable standing than other cryptos. The author goes on to mention around $96 million in flows into the Canaries’ spot ETF and ETF proposals yet to be passed.
He further highlighted that HBAR has a strong governance structure supported by large players such as Google, IBM, Boeing, and FedEx. Even with this strong support, the token remains significantly undervalued compared to its previous peaks.
From the perspective of price structure, according to Patel, the prevailing zone may be viewed as an accumulation pattern on the scale of several years within the range from $0.05 to $0.08, while an upside target of $1 is possible if trends of greater adoption persist.
HBAR Technicals Show Weak Direction
The technicals suggest that stability has been achieved without any trend reversal. The RSI is at approximately 50.42, reflecting neutral momentum. The price moves in line with the 20-day simple moving average at $0.08845. In higher timeframes, all three major SMAs remain above: 50-day SMA at $0.09165, 100-day SMA at $0.09646, and 200-day SMA at $0.12385.

Source: TradingView
Although momentum signals have improved, with the MACD line rising above the signal line while the histogram is positive, the overall structure of the market shows a lack of directional momentum. Therefore, an upward movement would require a period of buying to confirm the change.
This article contains market analysis and price predictions. These are not guarantees. Crypto markets are volatile. Always DYOR. Not financial advice.
Also Read | 12 European banks select Fireblocks for MiCA euro stablecoin

Be the first to comment