


What to know:
- Bitcoin holds firm above $76K–$77K support, sustaining a stable consolidation range.
- RSI and MACD signals reflect steady buying pressure without overbought conditions.
- Holding support could trigger a move toward $80K, while breakdown risks downside pressure.

Bitcoin is steadily demonstrating strength within the market as it holds above important technical levels, maintaining a cautiously optimistic short-term outlook and controlled price action.
At the time of writing, Bitcoin (BTC) is trading at $77,580, according to data from CoinMarketCap. The BTC records a 24-hour trading volume of around $34.58 billion and a total market capitalization close to $1.56 trillion. Over the last 24 hours, Bitcoin decreased 0.65%, reflecting subdued volatility as the market continues to consolidate within a narrow range.


Source: CoinMarketCap

Also Read | XRP Triangle Formation Intensifies as 10% Move Nears Breakout Zone
Bitcoin Defends Support Signals Upside
A popular crypto analyst, Ted, pointed out that Bitcoin is currently trading strongly above an important support level, which is helping to create its current short-term bullish technical pattern.

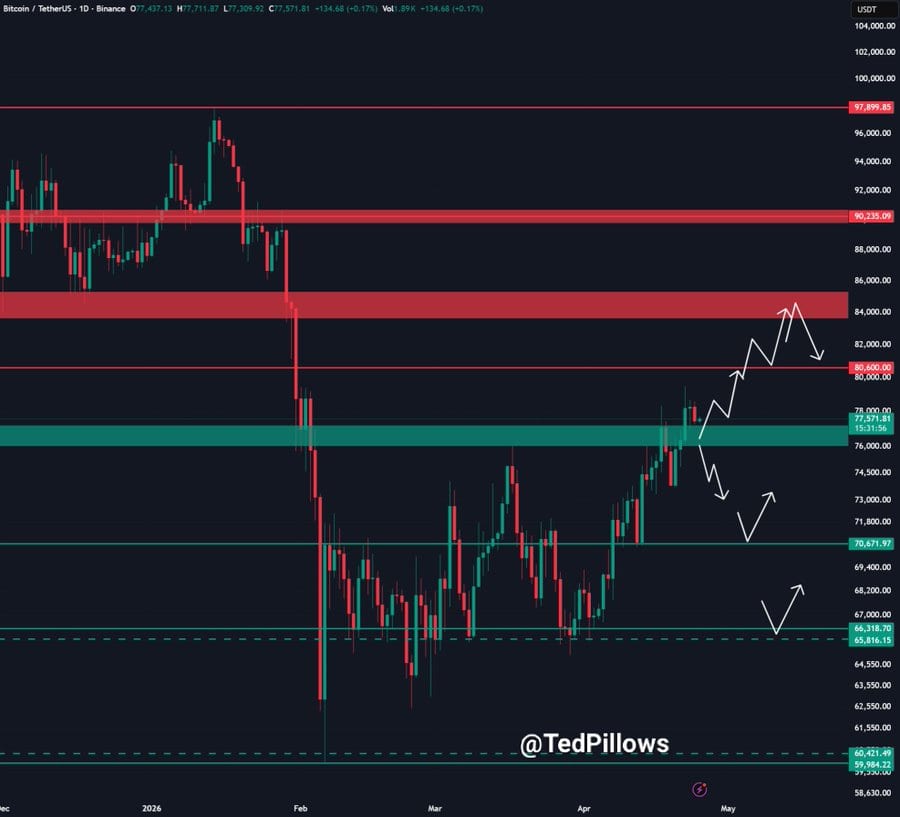
Source: Ted’s X Post
Analyst Ted noted that if BTC does not fall below the range of $76,000-$77,000, then an attempt might still be made to push towards resistance at the $80,000 mark. On the other hand, a failure to stay above the $76,000 barrier might lead to lower strength levels.
Bitcoin Momentum Strengthens Above Key Averages
In terms of technical analysis, there seems to be momentum symmetry in the BTC pair with an edge toward bullish sentiment. The current reading on the RSI indicator is 63.18, indicating continued buying pressure without being overbought.
The moving averages have also shown the strength of the prevailing trend. Bitcoin is trading above its 20-day, 50-day, and 100-day moving averages at $74,483, $73,325, and $71,354, respectively, suggesting that the market scenario remains positive for Bitcoin.

Source: TradingView
However, the 200-day moving average at $85,207 is still an important resistance level to keep in mind for future upswings.
The momentum signals have improved. The MACD is still above the signal line, while the histogram remains positive. This implies that there is sustained buying pressure, which means the price can keep rising steadily.
Bitcoin Steady As Support Holds
Overall, at the moment, the price action of Bitcoin continues to consolidate in a stable range with a slightly bullish sentiment. While the price is being supported by significant technical support levels.
The indicators in the market continue to show that the bulls are still holding the momentum. The decisive move will be determined by how the $76,000 support level holds for a possible rally to $80,000.
This article contains market analysis and price predictions. These are not guarantees. Crypto markets are volatile. Always DYOR. Not financial advice.
Also Read | AWS and Chainlink Integration Redefines Secure Blockchain Data Infrastructure
Be the first to comment