


What to know:
- GALA nears key descending trendline, with breakout target at $0.011 if momentum continues.
- Price broke above SMA ribbon, shifting resistance into support and strengthening bullish structure.
- RSI at 69.26 shows strong buying pressure as it approaches overbought territory near resistance.

Gala (GALA) is moving in a bullish trajectory with the strong breakout in sight as the token is approaching the descending trendline resistance. According to CoinMarketCap, the GALA price has surged by 9.24% over the last 24 hours and 6.94% over the last week.
At the time of writing, GALA is trading at $0.003567 with a trading volume of $139.18 million, which has surged explosively by 490.04% over the last 24 hours. However, its market capitalization stands at $169.91 million, which is also up by 9.51%.


Source: CoinMarketCap

Also Read: GALA’s Falling Wedge Pattern Signals an Explosive Move Toward $0.07 Target
GALA Bullish Breakout Could Spark Rally to $0.011
Furthermore, the crypto analyst Clifton Fx highlighted that GALA appears to be attracting market interest again based on the formation of a trend line on its daily chart, which could lead to a change in momentum soon.
This kind of situation depicts a period of consolidation, when both buyers and sellers try to dominate. This could be the beginning of an important move.
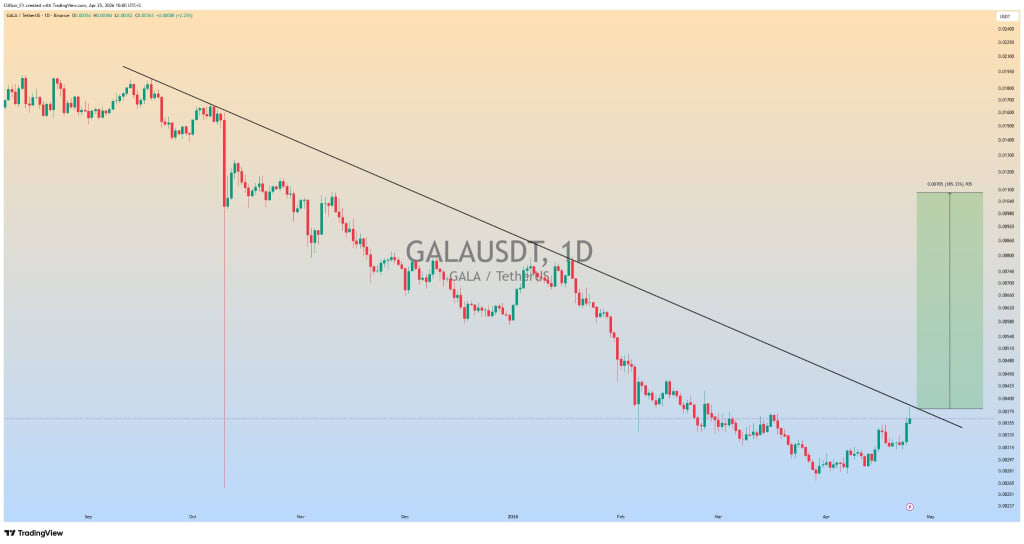
Source: Clifton Fx’s X Post
If GALA breaks through this trend line with a good momentum candle with accompanying volume, then this will most likely initiate a bullish run all the way to the $0.011 mark.
It is crucial to emphasize that the signal should be confirmed, since it happens quite often in the volatile environment of cryptocurrencies that traders experience false breakouts.
Technical Indicators Point to Strong Bullish Momentum
According to TradingView, GALA is showing signs of being bullish after the price managed to break through the SMA ribbon that acted as resistance before.
The price level at which it is currently trading is $0.00357. What traders are keeping their eyes on right now is the next key overhead resistance level, which is at $0.00394.

Source: TradingView
The RSI is now standing at 69.26 and implies rapid growth in buying pressure. Considering that the indicator is approaching the 70 level, which shows an overbought situation.
It can be assumed there will be a sharp rise in positive investor sentiment. This could be considered a short-term trend, but caution should be taken into account.
This article contains market analysis and price predictions. These are not guarantees. Crypto markets are volatile. Always DYOR. Not financial advice.
Also Read: GALA Holds $0.003 Support as Bullish Momentum Builds Toward $0.006

Be the first to comment