


What to know:
- ATOM’s bullish structure shift and liquidity sweep suggest continuation, with upside targets at $2.10, $2.51, and $2.69.
- ATOM holds key levels above the 20-day and 50-day EMAs, with support around $1.85–$1.98.
- The MACD crossover and rising momentum signal stronger buying pressure and possible upward continuation.

Cosmos (ATOM) is moving in a consolidation phase following the cautious environment in the crypto market. According to CoinMarketCap, as of Sunday, April 26, the ATOM price has shown stability over the last 24 hours but remains up by 12.73% over the last week.
At the time of writing, ATOM is trading at $2.02, with a trading volume of $46.93 million, which has declined by 24.95% over the last 24 hours. However, its market capitalization stands at $1.02 billion, which is also up by 1.14%.

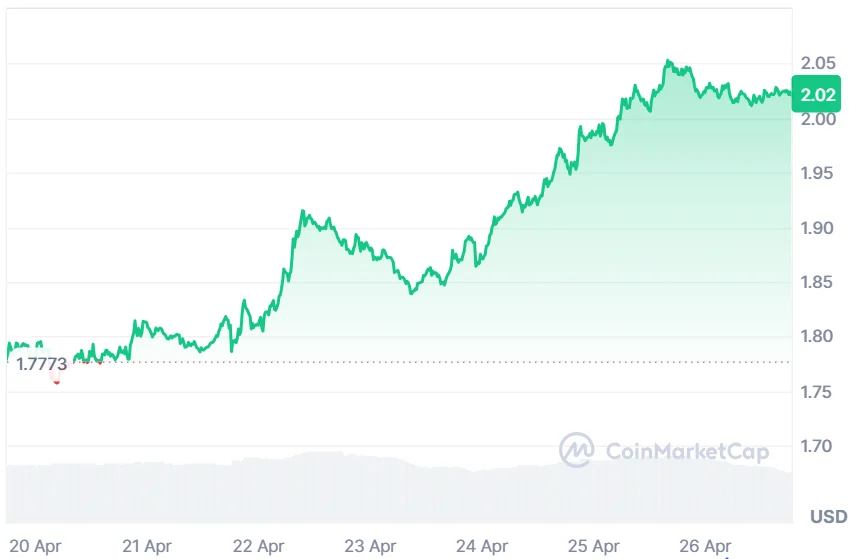
Source: CoinMarketCap

Also Read: Cosmos (ATOM) at Critical $1.735 Level: Rejection or Breakout Toward $10.50 Ahead
ATOM Eyes Breakout After Bullish Market Shift
Furthermore, the crypto analyst Crypto Patel pointed out that ATOM is gaining attention this week as price action shifts into a bullish structure, offering traders a compelling risk-reward opportunity.
After sweeping sell-side liquidity, the market reversed sharply, signaling a potential trend change. This move suggests stronger hands have entered, positioning the asset for a continuation toward higher levels in coming sessions.

Source: Crypto Patel’s X Post
The bullish outlook is reinforced by a confirmed market structure shift, along with a strong reaction from a key demand zone often linked to institutional order flow.
Momentum has accelerated through an impulsive move, supporting continuation. With liquidity resting above, price is naturally drawn toward targets at 2.10, 2.51, and potentially 2.69 in the near term.
However, although there is an optimistic chart formation, risk is still very clear, whereby failure to close above 1.680 would negate the entire bullish scenario.
It would be prudent for traders to wait for a pullback into the support region before executing any move, as this will ensure that their entries match the momentum.
Technical Indicators Point to Bullish Recovery Attempt
According to TradingView, ATOM presents a bullish bias as the price action breaks out through crucial technical levels.
The price is able to move up through both the 20-period and 50-period EMAs, which act as immediate support around the $1.85 level. It is important that the price holds above the 100-period EMA at $1.98 for a rally to the $2.40 mark.

Source: TradingView
Furthermore, the MACD indicator shows bullish strength as the MACD line is currently above the signal line on the chart, indicating a positive value.
In addition to the moving histogram, it shows rising upward momentum. Currently, trading near $2.02, a consolidation is seen here, but the bulls are clearly in charge.
This article contains market analysis and price predictions. These are not guarantees. Crypto markets are volatile. Always DYOR. Not financial advice.
Also Read: Cosmos (ATOM) Bullish Breakout Signals a Strong Move Toward $10 Resistance

Be the first to comment