


What to know:
- Solana’s technicals highlight a neutral RSI (52.86) and weak bullish MACD, indicating a pause before the next move.
- Price action is forming higher lows, suggesting fading selling pressure and growing buyer strength.
- Analysts expect SOL to remain in a key decision zone, with $91 acting as the next critical resistance.

Solana (SOL) is moving in an upward consolidation phase following the changing conditions in the crypto market. According to CoinMarketCap, the SOL price has surged by 1.16% over the last 24 hours and 2.02% over the last week.
At the time of writing, SOL is trading at $86.75, with a trading volume of $2.63 billion, which has remained stable over the last 24 hours. However, its market capitalization stands at $49.95 billion, which has surged slightly by 1.15%.

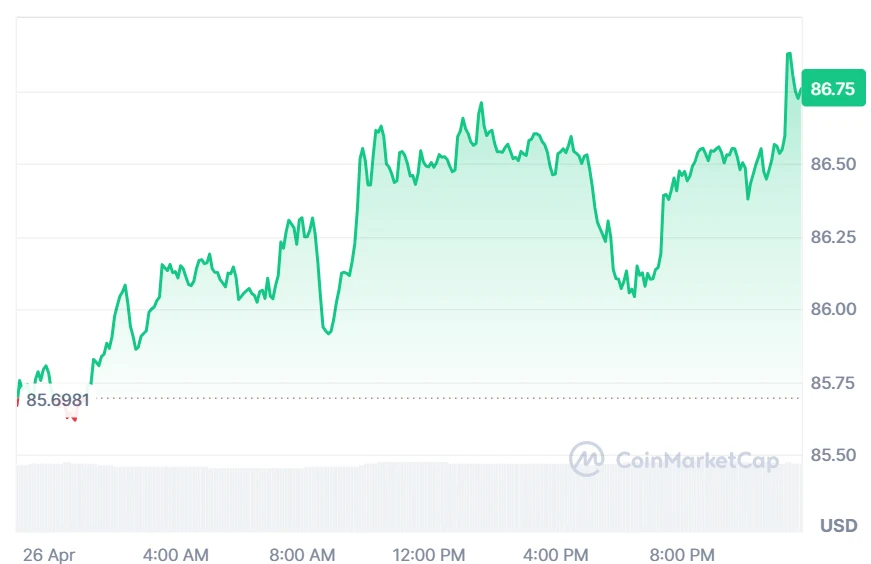
Source: CoinMarketCap

Also Read: Solana Price Prediction 2026-2032: Can SOL Reach $668 by 2032?
Solana (SOL) Price Action Signals Breakout Toward $91
Furthermore, the crypto analyst BitGuru pointed out that SOL is emerging from a consolidation phase into a more defined bullish structure.
After extended sideways movement, price action is forming higher lows from a prior reversal zone, suggesting improving buyer strength. This shift indicates that selling pressure is fading while the market gradually builds a foundation for potential upward continuation.


Source: BitGuru’s X Post
At the moment, SOL is consolidating close to an important resistance area, where the momentum has briefly come to a halt.
If the positive energy resumes with adequate volume backing, a breakout can take place, leading to further gains towards previous peaks around $91. Otherwise, the asset will be caught in a crucial decision-making phase.
Momentum Indicators Point to Neutral Outlook
According to TradingView, the RSI is standing at 52.86, while the signal line stands at 52.07. This shows that the token does not have any strong direction and is thus not overbought or oversold since it remains far from these extremes. The fact that RSI is above the signal line means there is some bull strength in the market.
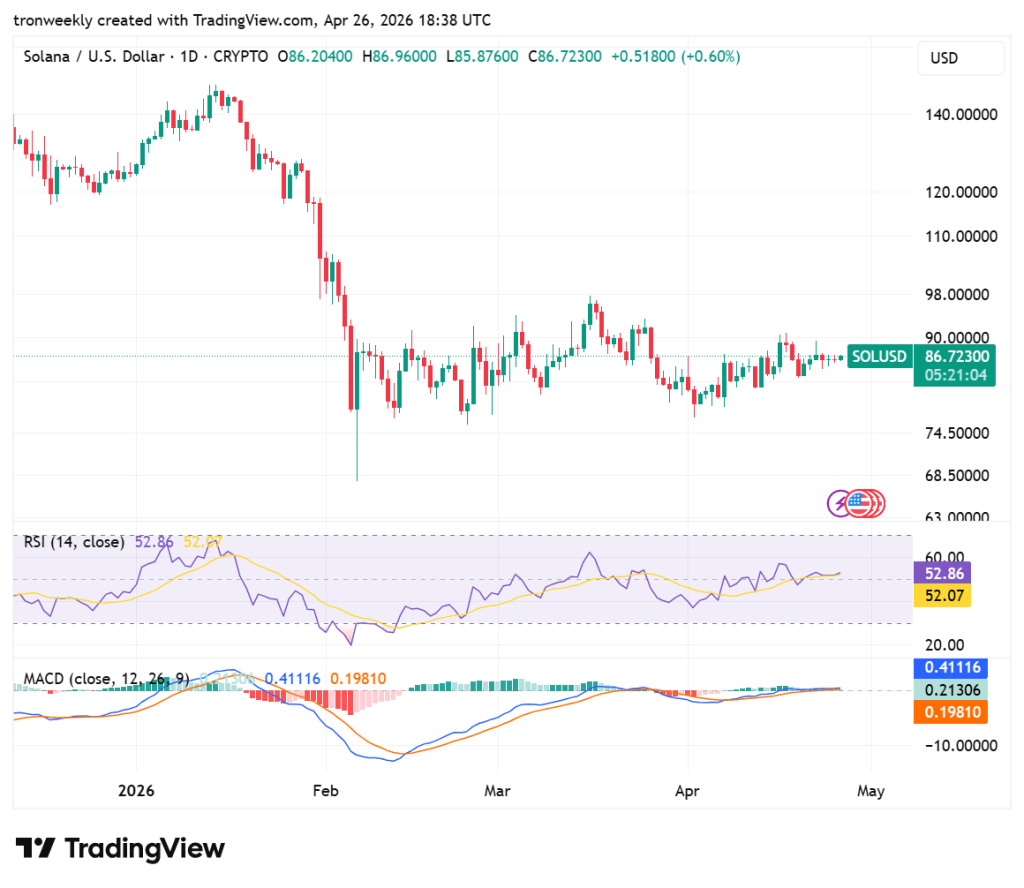
Source: TradingView
The MACD chart also shows consolidation, where the blue line is standing at 0.41116 while the orange line is at 0.19810.
The positive difference in the histogram at 0.21306 is indicating a weak buy trend, although the small difference in the two lines is indicating very little momentum. Generally, this setup is indicating a calm market environment.
This article contains market analysis and price predictions. These are not guarantees. Crypto markets are volatile. Always DYOR. Not financial advice.
Also Read: Solana Nears Key Resistance as Bullish Momentum Targets $100 Breakout

Be the first to comment