


What to know:
- DOT trading near $1.23 with momentum cooling after weekly decline.
- $1.20 remains the critical support level defining short-term direction.
- Analysts remain divided between breakout recovery and extended downtrend risk.

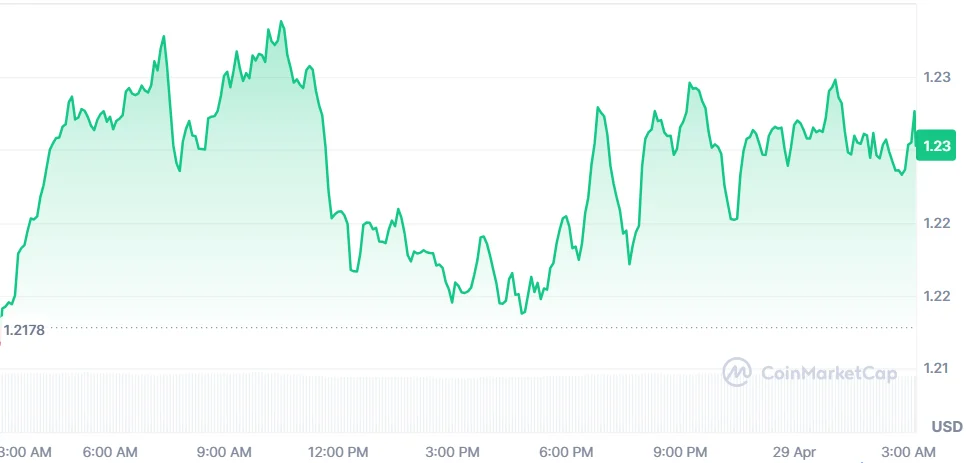
Polkadot (DOT) is trading at $1.23 on Wednesday, April 29, 2026, as the asset continues to move within a tight consolidation range. The token has posted a modest intraday gain of 0.98%, but broader sentiment remains weak after a 2.85% decline over the past week.
Market participation has also softened, with 24-hour trading volume falling to $125.47 million, down 4.42%. This combination of muted volume and range-bound price action suggests traders are currently waiting for a decisive breakout before committing to a stronger directional position.

Market Shows Ongoing Consolidation Phase
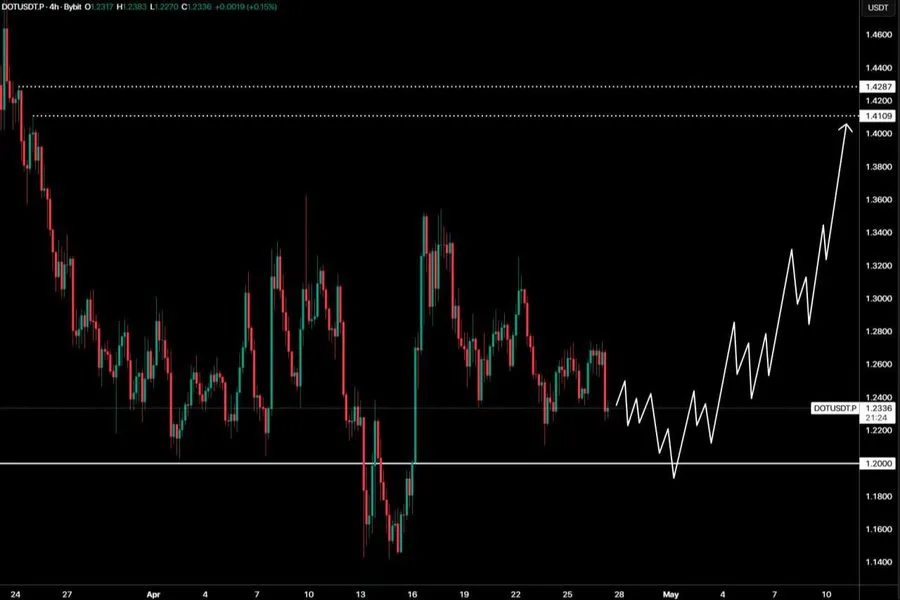
According to crypto analyst Profit Conscious, Polkadot is gradually approaching a key support zone at $1.20, which has repeatedly acted as a demand area in recent trading sessions. The 4-hour chart continues to show a well-defined range between $1.20 support and $1.40–$1.44 resistance.

This structure is commonly associated with consolidation phases where liquidity builds on both sides of the market. Price reactions within this zone suggest neither bulls nor bears have established full control.
A sustained move above $1.25–$1.28 would indicate strengthening bullish pressure and could open a path toward the upper boundary at $1.40. A confirmed breakout above that level, particularly on strong volume, may extend gains toward $1.55–$1.65, with broader upside projections reaching $1.80 in extended momentum scenarios.
On the downside, a clean break below $1.20 would weaken the current structure and expose the asset to deeper retracement levels near $1.10–$1.05.

Also Read | Polkadot (DOT) Down 98% From $55 ATH, Eyes $1 Zone
Polkadot Price Analysis on Higher Timeframes
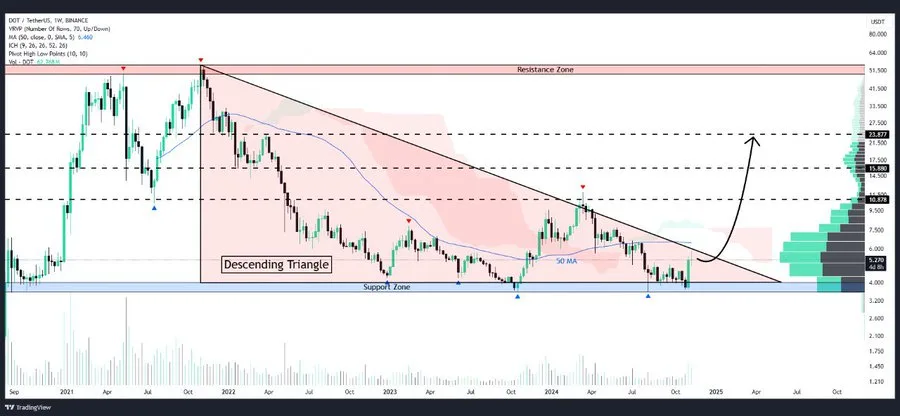
Another crypto analyst Whales_Crypto_Trading highlights a contrasting bearish structure forming on higher timeframes. DOT appears to be shaping a descending triangle, marked by lower highs and a horizontal support region historically associated with heavier trading activity.
This structure indicates continued selling pressure despite temporary stabilization. A breakdown below the $4–$5 macro support region (on higher timeframe charts referenced by the analyst) could trigger a deeper correction toward $2.5–$3.0, reflecting a continuation of the longer-term downtrend.
Conversely, a breakout above the descending trendline and a recovery toward the $8–$10 region would invalidate the bearish setup. In that case, price expansion could extend toward $10–$12 initially, with further upside potential toward $14–$16 and higher if momentum strengthens.

Also Read | Polkadot (DOT) Below EMAs: Can It Break $2.35 Resistance Level?

Be the first to comment