


What to know:
- TRB breaks multi-year resistance, hinting at a bullish reversal.
- Open interest and volume surge, signaling strong market activity.
- Key resistance at $21.57; breakout could push higher.
Tellor (TRB) has expanded its consolidation phase with a reversal in sight, as the token has broken above the multi-year resistance. According to CoinMarketCap, as of Friday, May 1, TRB is currently trading at $19.12, with a 24-hour trading volume of $75.76 million and a market capitalization of $53.1 million. Its price has shown stability over the last 24 hours but remains up by 1.83% over the last week.
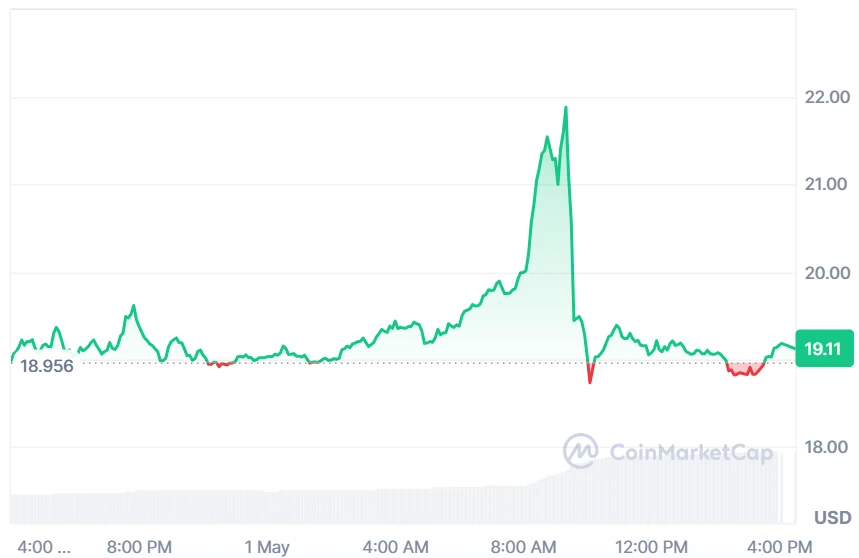
Source: CoinMarketCap
Also Read: TRB Whales Reap $3.56M Profit Amidst Soaring Prices: Report

TRB Derivative Data Point to Growing Potential
According to Coinglass, TRB open interest rose 25.14% to $39.22M, while volume increased 234.32% to $173.97M, reflecting strong trading activity, rising participation in derivatives markets, and sustained inflows indicating growing momentum and heightened engagement across the market.
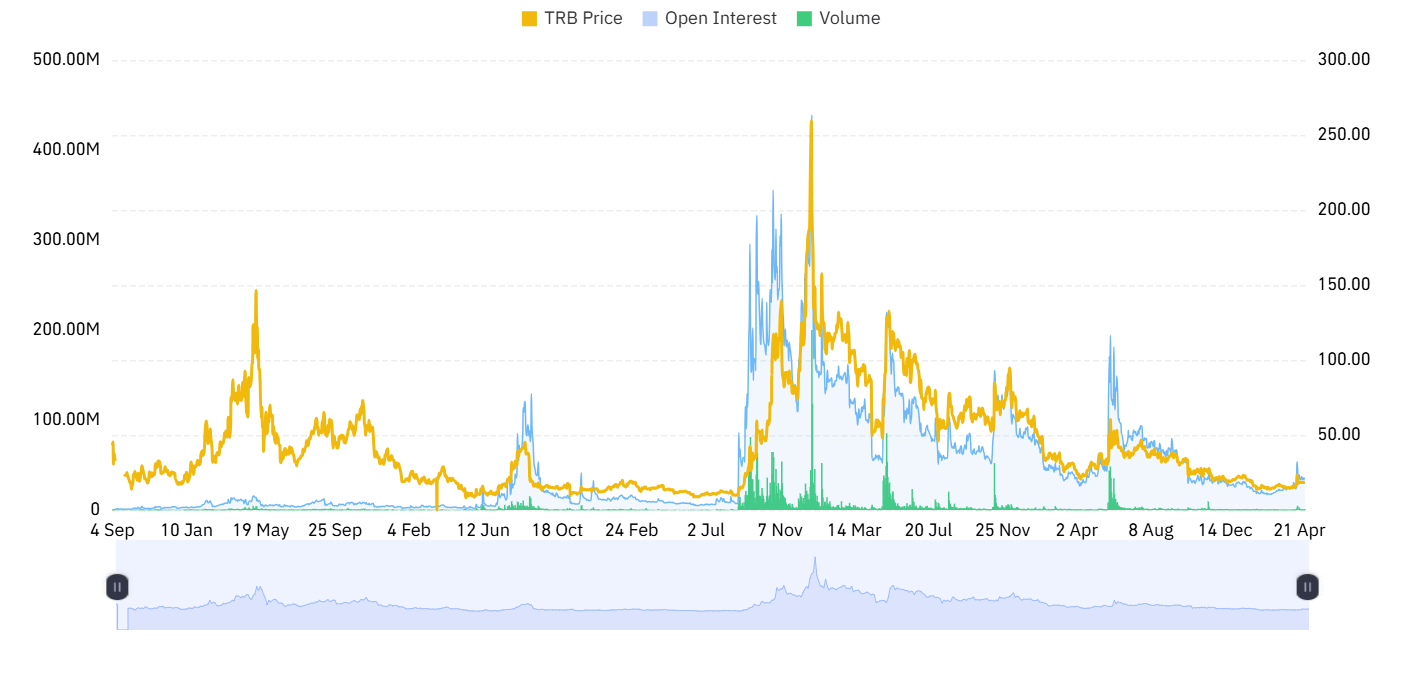
Source: Coinglass
However, the OI-weighted funding rate of 0.0040% indicates slightly positive funding conditions, suggesting mild bullish positioning, balanced leverage between longs and shorts, and stable derivatives sentiment with limited pressure, reflecting controlled speculative activity across participants’ overall tone.

Source: Coinglass
TRB Multi-Year Resistance Break Sparks Reversal Hopes
Furthermore, the crypto analyst Javon Marks highlighted that TRB has managed to penetrate a multiyear resistance line, which has been restraining its price action over the past two years, implying a change in the underlying strength of the token.
The penetration of the resistance level is considered a bullish signal for the token and could be a precursor to a new bearish-to-bullish trend.
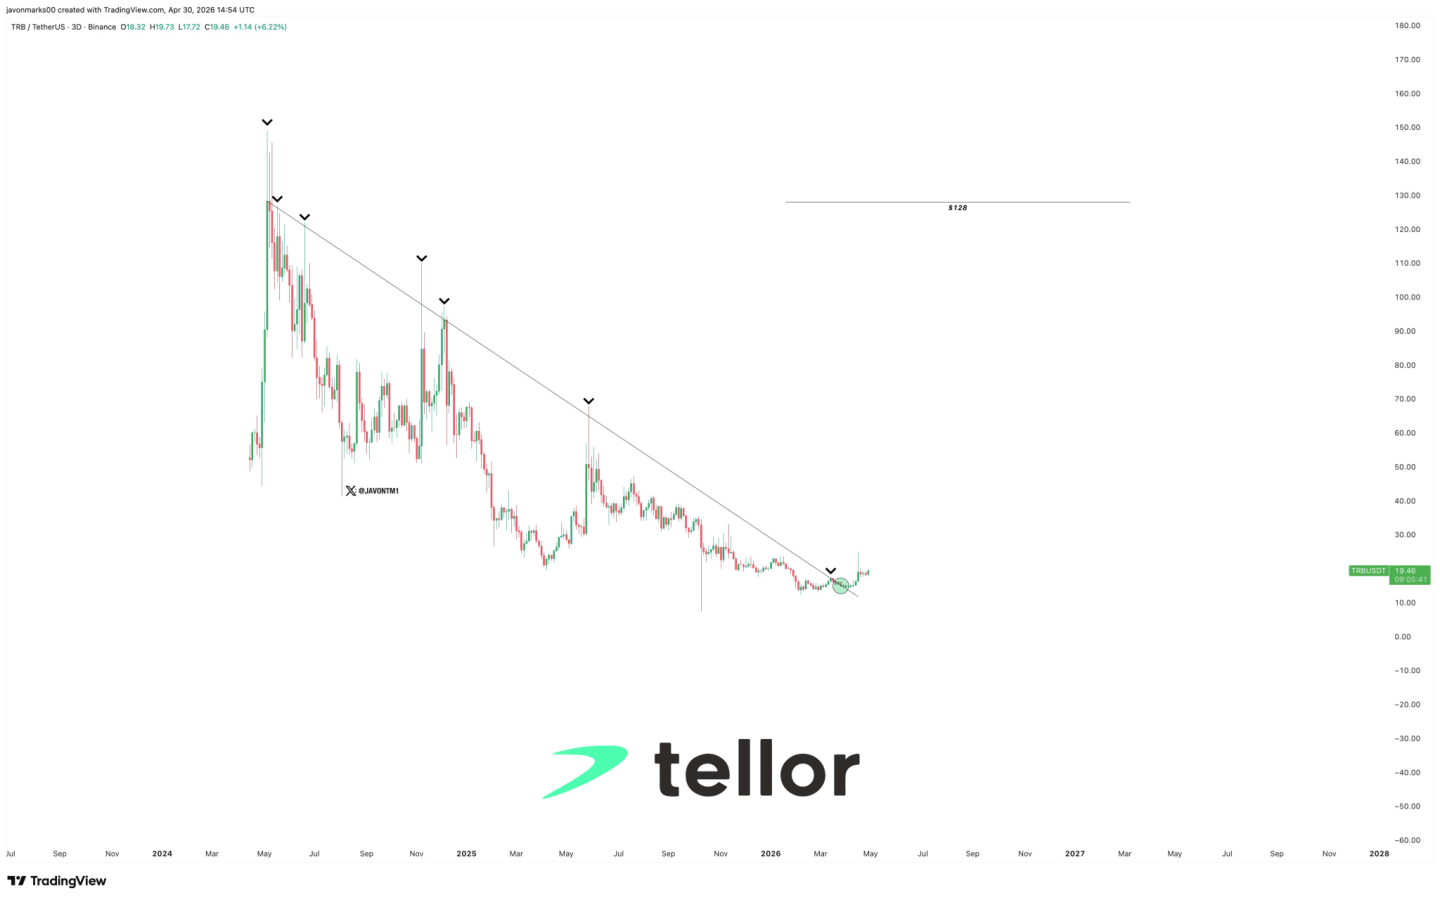
Source: Javon Marks’ X Post
Market predictions suggest that there could be a rise towards the $120-$130 region, depending on whether the momentum is maintained.
However, caution has been raised about high volatility in the market, and it might even be possible to see some corrections to the breakout level, which may add support for further gains in the future.
Technical Indicators Point to a Recovery Phase
According to TradingView, TRB is on a path of revival. The token has gone down to about $12.00, jumped up to $24.00, and settled at about $19.017.
Trading above its 20, 50, and 100 days Exponential moving averages indicate a bull market sentiment, as these indicators keep adjusting higher to meet the present prices.
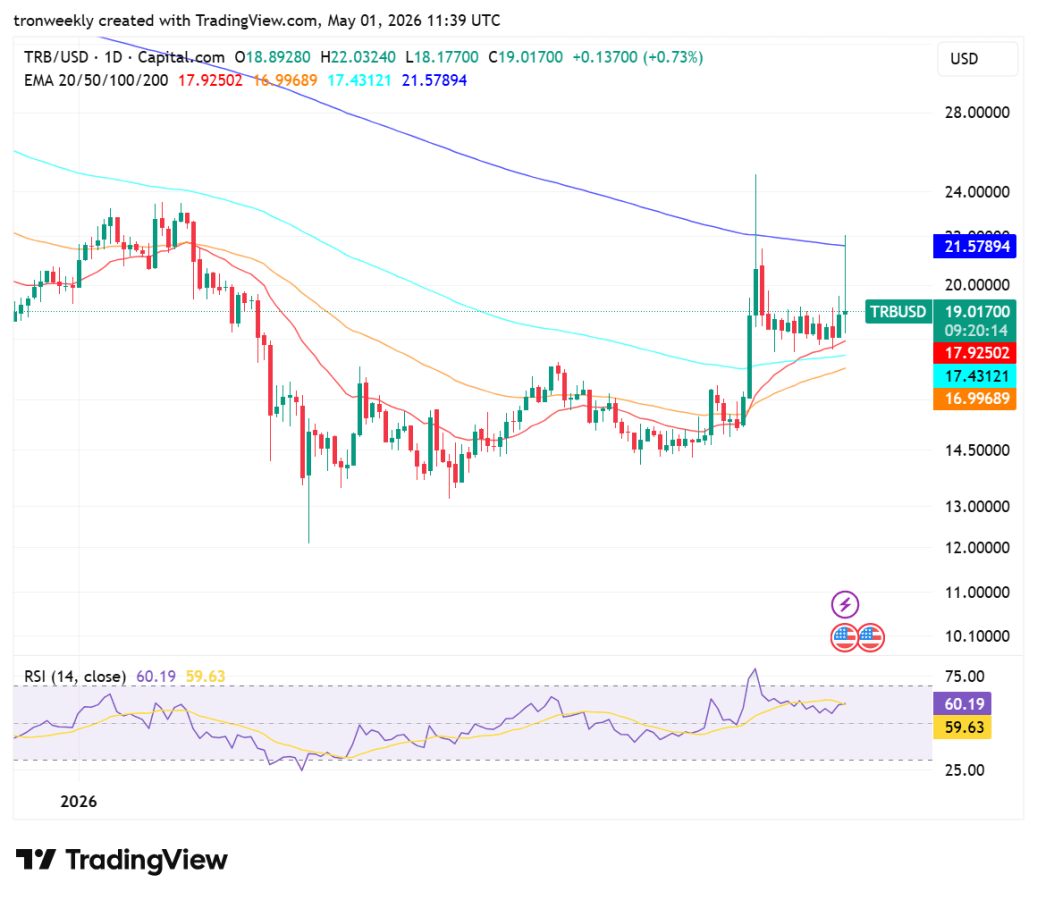
Source: TradingView
The Relative Strength Index is currently standing at 60.19, which means momentum is stable, but it isn’t overbought yet. However, the token has a strong resistance at $21.57, where the 200-day exponential moving average is found.
A successful break through the resistance will be an indicator of a bullish reversal, whereas failure will push prices back to $17.00.
This article contains market analysis and price predictions. These are not guarantees. Crypto markets are volatile. Always DYOR. Not financial advice.
Also Read: Tellor (TRB) Price Analysis: TRB Eyes $55 Resistance After Breakout

Be the first to comment