


What to know:
- Uniswap (UNI) is testing a key descending triangle support zone as bearish pressure continues to dominate short-term structure.
- RSI around mid-40s and mixed MACD signals indicate consolidation, with no confirmed bullish reversal yet.
- Analysts eye potential recovery targets if support holds, with upside levels projected toward $4.20 and higher Fibonacci zones.

Uniswap (UNI) is presently experiencing an essential pattern, since the coin attempts to test support levels following its decline trend. Right now, UNI’s price action is following an essential pattern whereby weak momentum exists, and at the same time, sellers remain in control of buyers.
At the time of writing, Uniswap (UNI) is trading at $3.22, according to market data from CoinMarketCap, with a 24-hour trading volume of $108.72 million and a market capitalization close to $2.05 billion. The UNI has declined 0.64% over the last 24 hours, reflecting continued hesitation across DeFi tokens as broader sentiment remains uncertain and upward momentum stays limited.

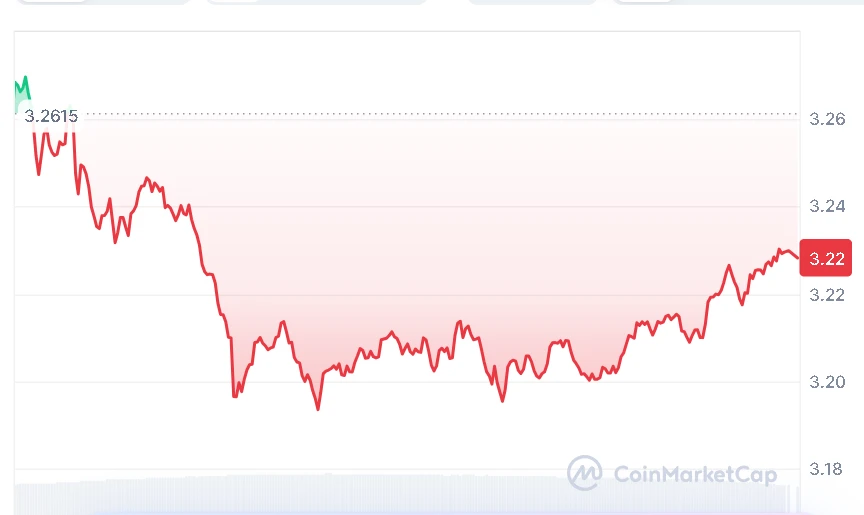
Source: CoinMarketCap

Also Read | World Liberty Financial Faces Backlash After 5.9 Billion Token Sale Revelation
Uniswap Tests Key Triangle Support
As reported by a crypto analyst Jonathan Carter, the UNI is currently reacting to the support level of the descending triangle formation on the 2-week time frame. The price action has attempted to consolidate itself near the bottom part of the formation and can be considered as a zone for accumulation during increased buying pressure.

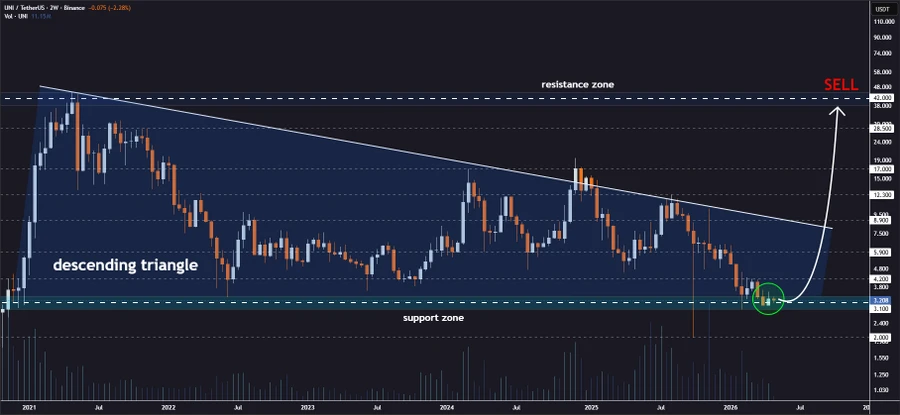
Source: Jonathan Carter’s X Post
Carter further provided possible projections from this setup in levels such as $4.20, $5.90, $8.90, $12.30, $17.00, $28.50, and $42.00.
Uniswap Shows Weak Market Momentum
From a technical perspective, UNI is still trading below the important levels of Moving Averages, such as the MA Ribbon, which is found at the levels of $3.26, $3.37, $3.60, and $4.79. In addition, the level of RSI is close to 46.74, which shows the weakness of the buyers and the inability of traders to make decisions.
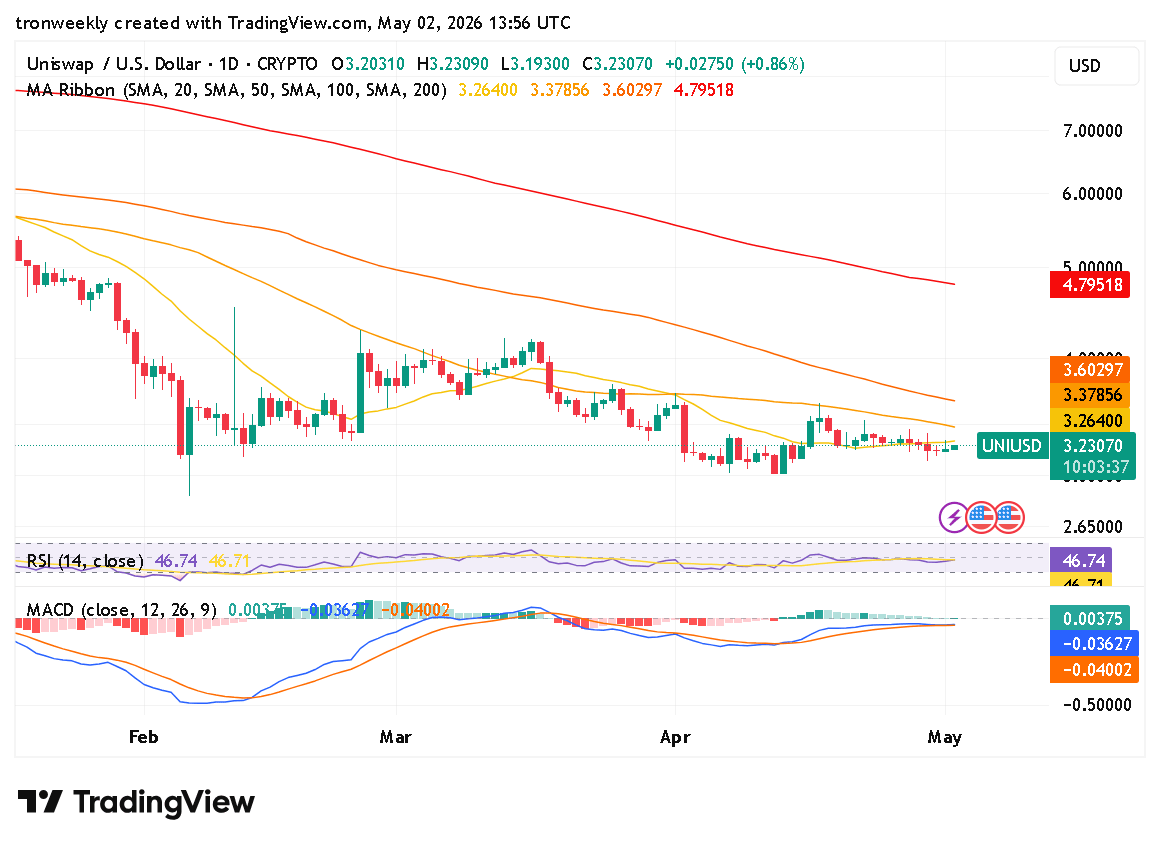

Source: TradingView
Furthermore, momentum indicators have also captured an ambiguous environment for the markets. Although the MACD is still positive at 0.00375 levels, it is trading below the signal line with a negative histogram.
The above statement indicates that although the downside pressure has decreased, it has yet to convert into positive momentum. Overall, it seems that UNI is trading within a range-bound phase.
This article contains market analysis and price predictions. These are not guarantees. Crypto markets are volatile. Always DYOR. Not financial advice.
Also Read | XRP Forms Symmetrical Triangle as Breakout Setup Targets $1.82 on Breakout

Be the first to comment