


What to know:
- Solana (SOL) is trading near $84 in consolidation, with indicators suggesting a potential breakout.
- Solana leads Layer 1 and Layer 2 in DApp revenue and DEX volume, pointing to strong network growth.
- Coinglass data shows mixed sentiment, with rising open interest and falling volume signaling cautious trading.
Solana (SOL) is moving in an upward consolidation phase with a reversal in sight as the Solana network is making great progress in blockchain technology. According to CoinMarketCap, SOL is currently trading at $84.07, with a 24-hour trading volume of $2.41 billion and a market capitalization of $48.45 billion. Its price has shown stability over the last 24 hours but remains down by 2.35% over the last week.
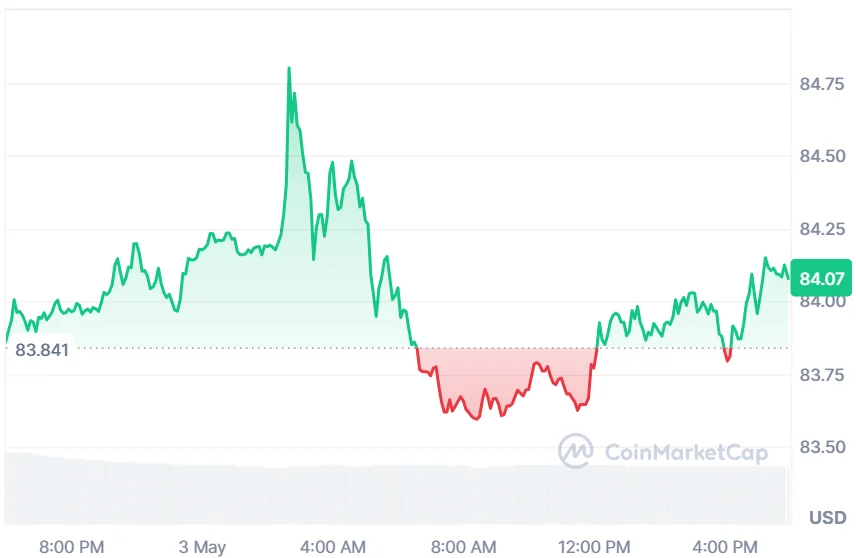

Source: CoinMarketCap
Solana Dominates Layer 1 and Layer 2 in On-Chain Activity
However, according to Solana Floor data, Solana continues to lead across Layer 1 and Layer 2 ecosystems in daily and weekly DApp revenue as well as decentralized exchange (DEX) volume.

This sustained performance reflects consistently high on-chain user activity, where traders and applications generate significant economic throughput, reinforcing Solana’s position as one of the most actively used blockchain networks.
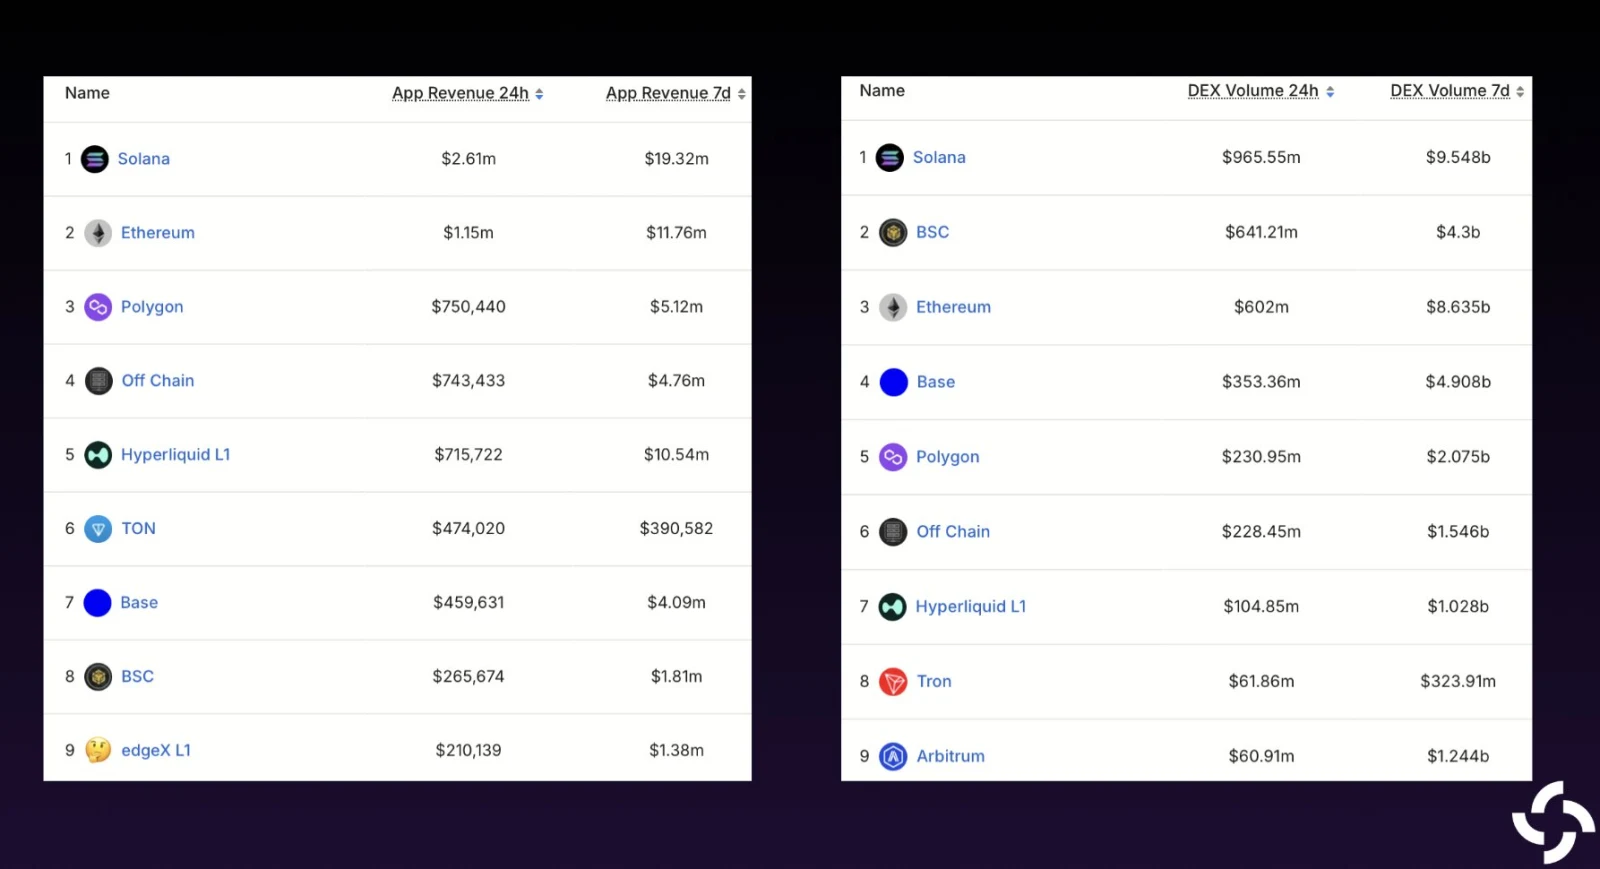
Source: Solana Floor’s X Post
The surge is largely driven by low fees, fast transaction speeds, and strong DeFi and trading engagement across its ecosystem.
Compared with other chains, Solana’s ability to attract high-frequency trading and liquidity flows has helped it maintain dominance in activity-based metrics, signaling a shift in user preference toward faster and more cost-efficient blockchain environments.
Also Read: Shinhan Card Partners With Solana Foundation to Launch Stablecoin Payment
Solana Derivatives Point to Cautious Outlook
According to Coinglass, the SOL open interest increased slightly by 0.09% to $4.84B, indicating a modest rise in active derivative positions and continued market participation. Volume fell by 26.79% to $4.45B, reflecting reduced trading activity and weaker liquidity compared to the previous period overall.

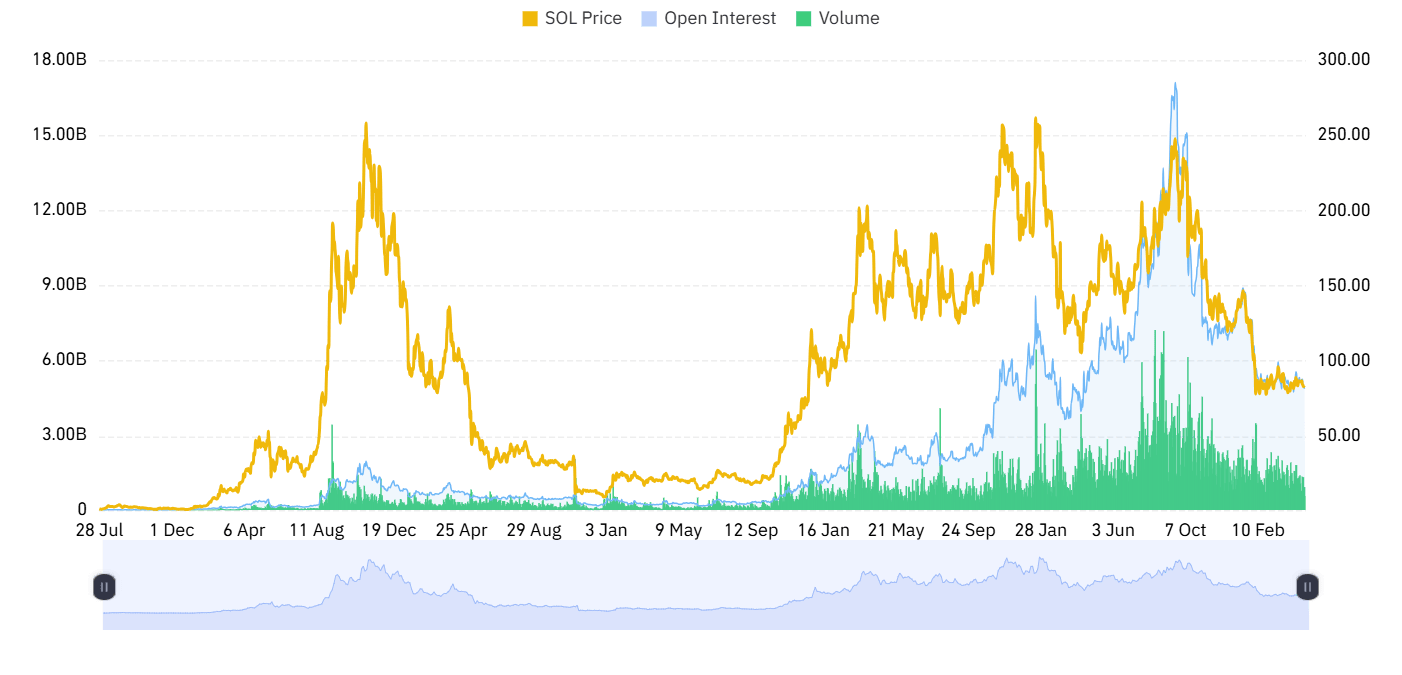
Source: Coinglass
The OI-weighted rate stands at –0.0073%. It suggests that there may be a slight tendency towards a negative funding environment for derivatives. The traders have an air of being a bit pessimistic, playing safe with their cautious positions and lack of strong directionality.
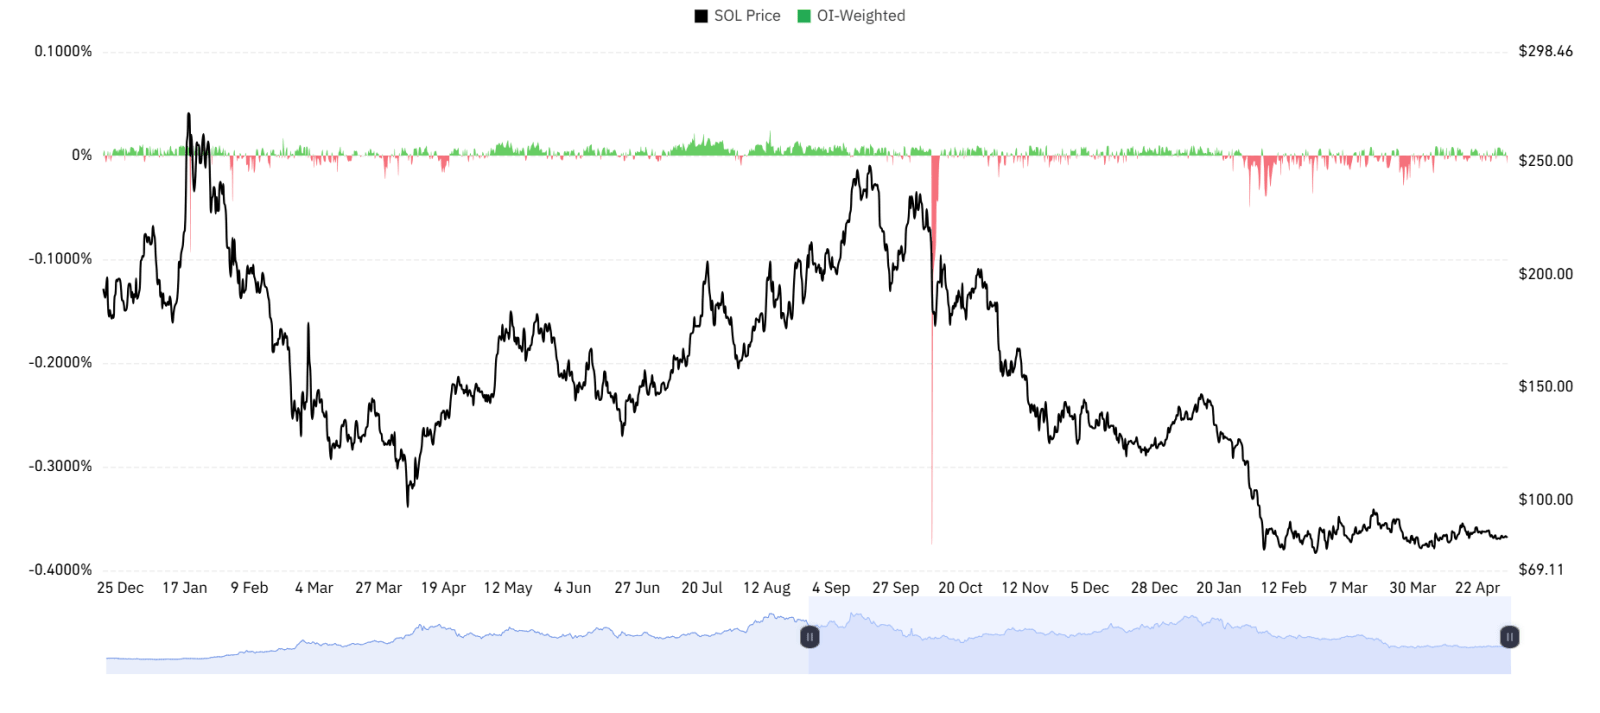
Source: Coinglass
Technical Indicators Point to a Consolidation Phase
From the price action perspective, SOL exhibits a clear transition from volatility to a lengthy period of stability. According to TradingView, the sharp fall in February from $140 to $66 resulted in the price being trapped in a range-bound pattern.
Currently trading near $84.10, the asset is trading below its 20-day simple moving average (SMA), indicating that the sentiment may be neutral.
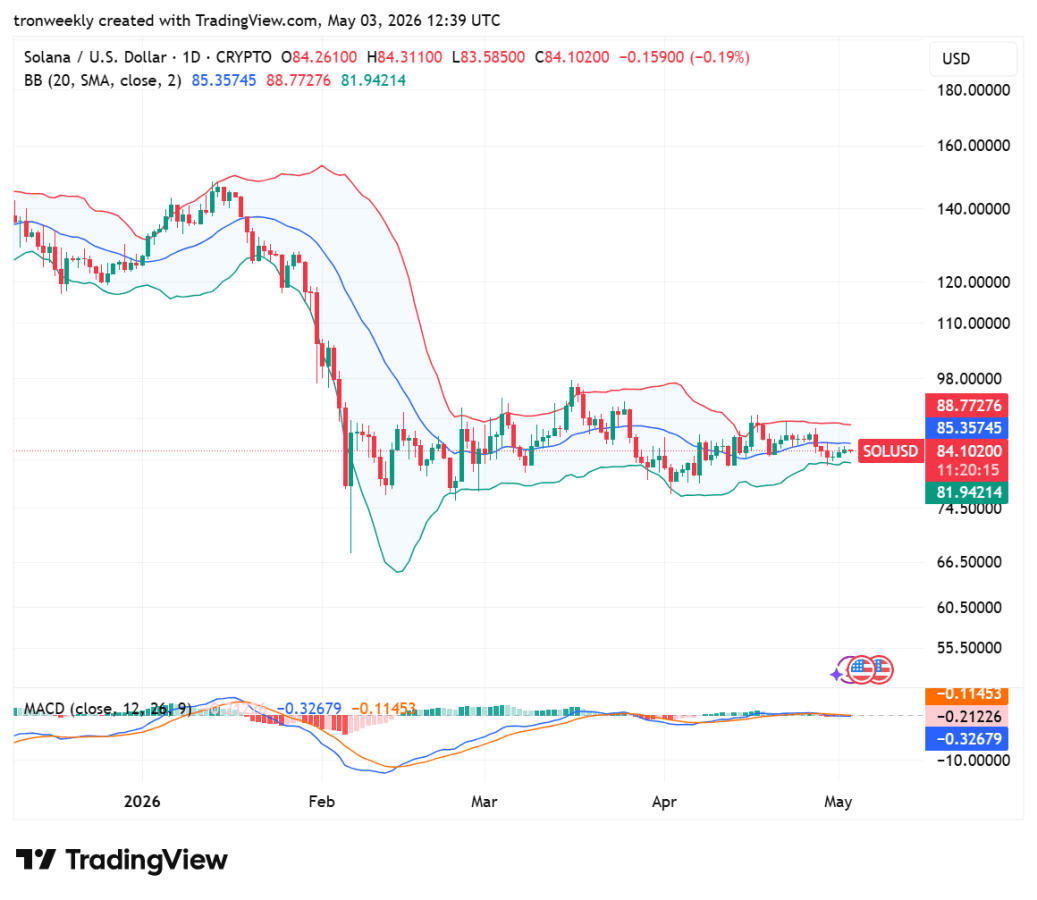
Source: TradingView
Indicators reflect weak momentum as MACD is converging on zero, while the histogram does not show any activity, emphasizing the absence of clear momentum.
Being limited by a resistance level of $88.77 and the support level of $81.94, there is no particular trend. The weakness in momentum reflects that traders are awaiting a trigger for action.
This article contains market analysis and price predictions. These are not guarantees. Crypto markets are volatile. Always DYOR. Not financial advice.
Also Read: Solana Moves Sideways as Support Holds, Eyes $88–$90 Resistance Target

Be the first to comment