


Bitcoin price is trading above $80,000, reaching a three-month high as Asian equity markets push toward record levels and risk appetite returns across global prediction markets. The $80,000 level marks a structural resistance zone that defined Bitcoin’s November 2025 lows and has acted as a ceiling through months of consolidation.
Retail investors are flooding back in amid the fear of missing out, while institutional buyers have been quietly draining available supply through ETFs for months. Now, can Bitcoin breach $90,000 this time around?
BREAKING: Bitcoin rises above $80,000 for the first time since January 31st. pic.twitter.com/QVb9slWgq3
— The Kobeissi Letter (@KobeissiLetter) May 4, 2026
$80,000 Triggers Retail FOMO Response Every Time
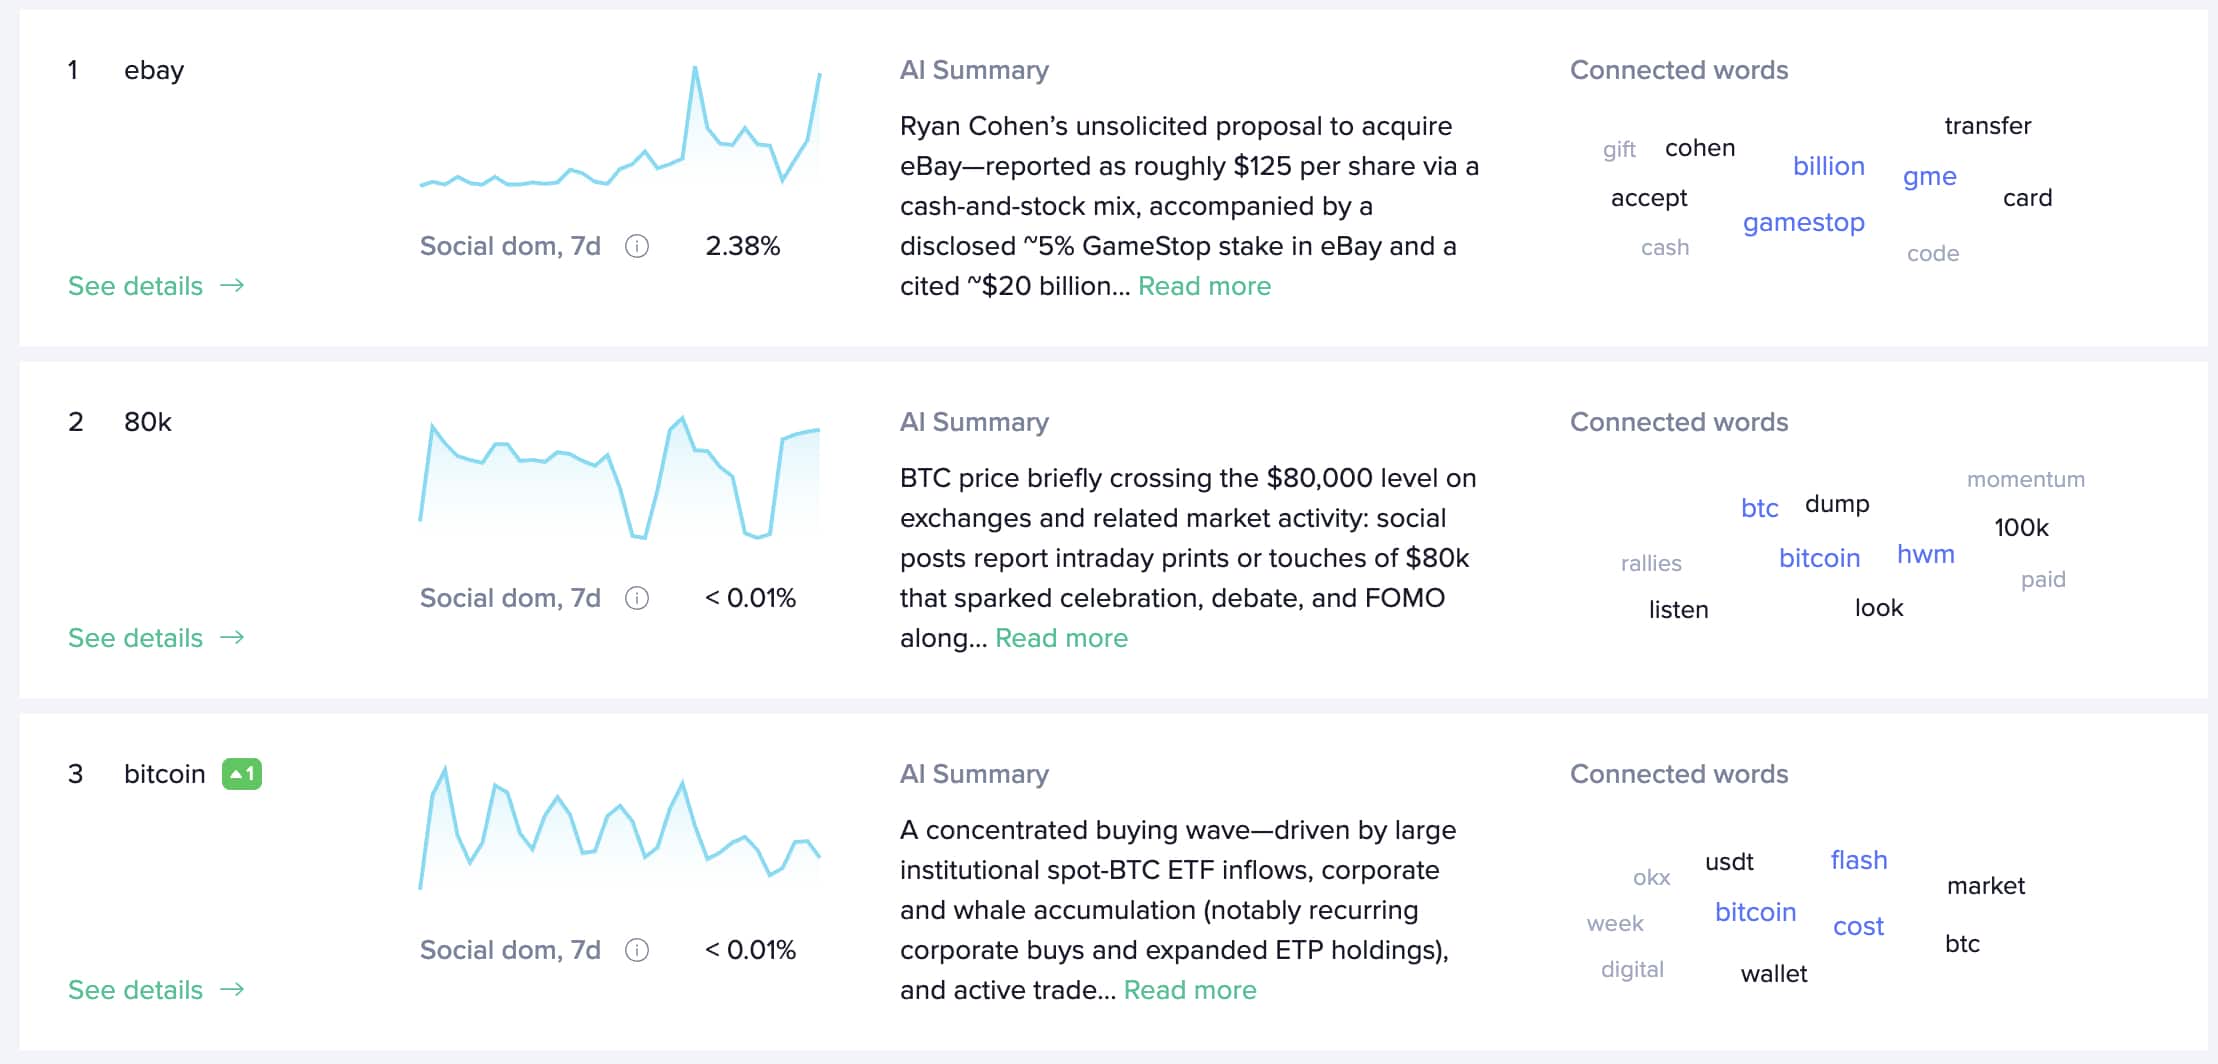
Round numbers do something specific to retail psychology that no chart pattern can fully capture. When Bitcoin $80,000 headlines start appearing, search traffic spikes, social volume surges, and new money moves toward the buy button.
Santiment data tracking social dominance and crowd sentiment showed a sharp uptick in bullish mentions as BTC crossed the $79,500 level, consistent with crowd enthusiasm that has historically preceded sharp reversals.

The parallel to 2021 is worth examining carefully. When Bitcoin first crossed $60,000, that cycle, retail FOMO drove a powerful surge. But crypto retail FOMO at major milestones tends to compress the remaining upside while amplifying downside risk for latecomers.
A recent 99Bitcoins analysis examining extreme bullish sentiment as a potential warning signal noted that crowd euphoria at technical inflection points has functioned as a contrarian indicator in prior cycles. It’s not a guarantee of reversal, but a reason to stay analytical.
DISCOVER: 10+ Next Crypto to 100X In 2025
The ETF-Driven Bitcoin Supply Shock Is Real
While retail attention focuses on price milestones, the more consequential development has been happening off-exchange for months. Spot Bitcoin ETF products, led by BlackRock’s IBIT and Fidelity’s FBTC, have been absorbing Bitcoin from the open market at a pace that consistently outstrips new miner supply.
This is a gradual, structural compression of the supply of liquid Bitcoin that gradually makes each Bitcoin harder to acquire at current prices. Exchange reserves have dropped to multi-year lows, and the coins that retail investors would normally buy from other sellers are increasingly not there.
BTC ETF inflows have not been uniformly strong, but the cumulative effect of months of net positive inflows has left exchange balances at levels that make a sustained supply response to higher prices structurally difficult. On top of ETF demand, corporate treasury buyers continue to accumulate aggressively. It’s another layer of demand, removing coins from circulation with no near-term selling intention.
DISCOVER: 15+ Upcoming Listings to Watch in 2025
Bitcoin Price Prediction: Where Does It Go From Here
In a perfect world, BTC holds above $80,500 on a weekly close, ETF inflows remain consistent, and the S&P 500’s proximity to all-time highs sustains risk-on sentiment. Then Bitcoin tests $90,000–$93,000 within four to six weeks, with minimal overhead resistance in that range according to anchored VWAP analysis from the April 2026 lows.
Or, Bitcoin consolidates between $78,000–$82,000 for one to three weeks as the market digests the breakout. Retail FOMO fades slightly as no immediate continuation materializes, but institutional accumulation holds price above the prior resistance zone. The eventual resolution is still higher, just slower.
THE BIG MONEY IS BACK
Institutional investors just dumped $630M into Bitcoin and Ethereum ETFs in a single day. This isn’t retail FOMO—this is serious capital recognizing value at these levels.
When big funds load positions this heavily, retail followers. If institutions are… pic.twitter.com/SsNKq4G2M3
— CryptoCronicle (@Dibaas100) May 4, 2026
However, a failure to hold $80,000 on a daily close triggers stop-loss cascades in the $79,000–$80,000 liquidity zone, pushing BTC back toward $75,000–$76,000. This scenario becomes more likely if macro conditions shift, specifically, if equity markets reverse sharply or ETF inflows turn net negative for multiple consecutive sessions.
The key variable to watch is the daily ETF flow data. Two consecutive days of significant net outflows while BTC trades near $80,000 would be a meaningful warning sign that the institutional bid is softening at exactly the wrong moment.
DISCOVER: Top Crypto Presales to Watch Now
Follow 99Bitcoins on X (Twitter) For the Latest Market Updates and Subscribe on YouTube For Daily Expert Market Analysis.
Why you can trust 99Bitcoins
Established in 2013, 99Bitcoin’s team members have been crypto experts since Bitcoin’s Early days.
90hr+
Weekly Research
100k+
Monthly readers
50+
Expert contributors
2000+
Crypto Projects Reviewed


Follow 99Bitcoins on your Google News Feed
Get the latest updates, trends, and insights delivered straight to your fingertips. Subscribe now!


Be the first to comment