


What to know:
- Hyperliquid posts $3.64T volume and $993M revenue as activity surges.
- HYPE trades near $42, testing a strong resistance zone at $45.
- Momentum slows slightly, but structure still supports a higher move.

Hyperliquid has stepped into focus this week after a sharp rise in activity pushed several of its metrics to new highs. According to Alphractal’s data, the total trading volume and revenue of the platform were $3.64 trillion and $993 million, respectively.
There has been an all-time high performance in terms of transaction fees and other activities, with over 235.57K transactions on HyperEVM. It is evident that despite low interest from the general market, there has been gradual growth. Data indicates a shift in derivatives, which have equal long positions that are neither crowded nor stretched.
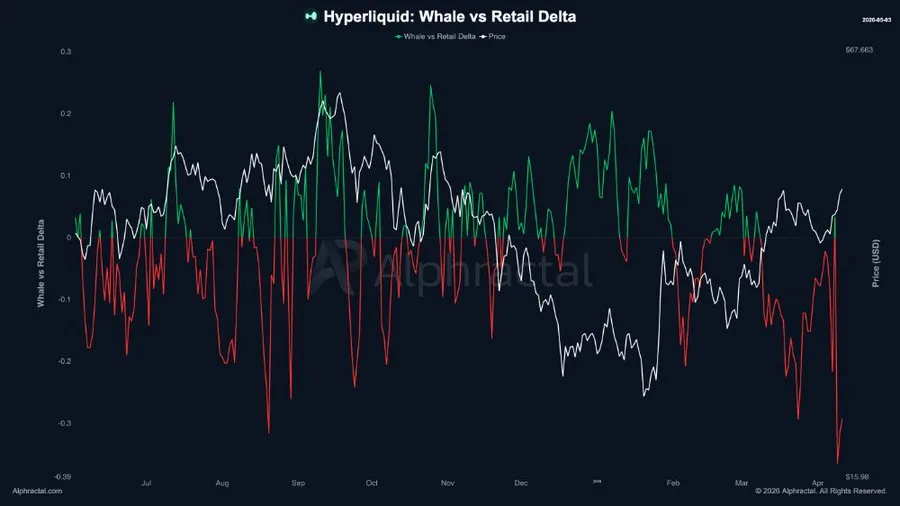

Source: X

This will result in stable price fluctuations, with decentralized exchanges continuing to take over from centralized exchanges in the market share battle. The current rise in activity is not short-lived in nature. We can observe increased
transactions and fees, meaning an increased level of user participation on the blockchain. HyperEVM is above the mark of 235.57K transactions, meaning that there has been increased use of the blockchain in terms other than trading as well.
Also Read: ICP Price Analysis Targets $2.95 as Bullish Structure Forms
HYPE Price Structure Near Key Resistance
With regards to pricing, HYPE has seen recovery from its prolonged downtrend. The price dropped from above $60 to about $22-$25. This became a support level whereby sales slowed while accumulation increased.
At that point, the price managed to break out of a downward channel, indicating a shift in trend. The price then returned to the $29 to $32 range and continued to climb to about $42.
It’s currently just below the resistance level between $42 and $45, which has normally seen the emergence of the sellers.
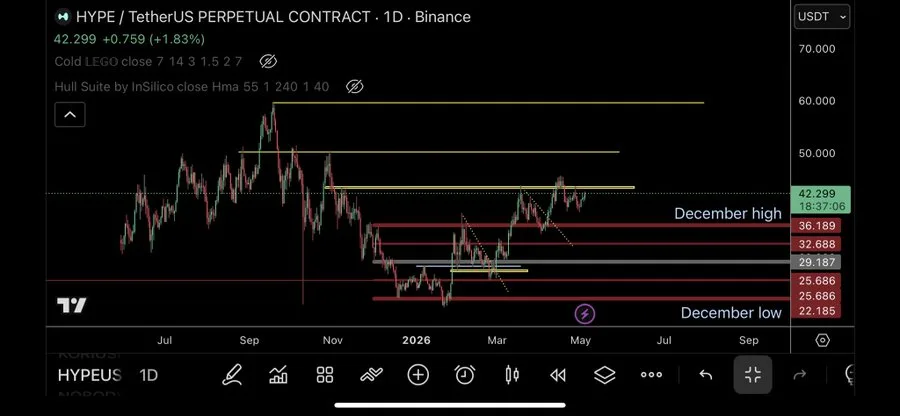

Source: X
Analyst trader SZ noted that the instrument has entered a bullish flag formation, which signals a potential further price increase, but only after confirmation of this formation.
Hyperliquid Momentum Signals Show Market Pause
According to technical indicators from Tradingview, the market appears to be experiencing a momentary breather rather than a reversal.
Bollinger Bands have indicated that the price has just hit the upper Band, and then contracting implies that the volatility has dropped. The 20-day average of around $41.67 seems to be forming a base for the upward trend.
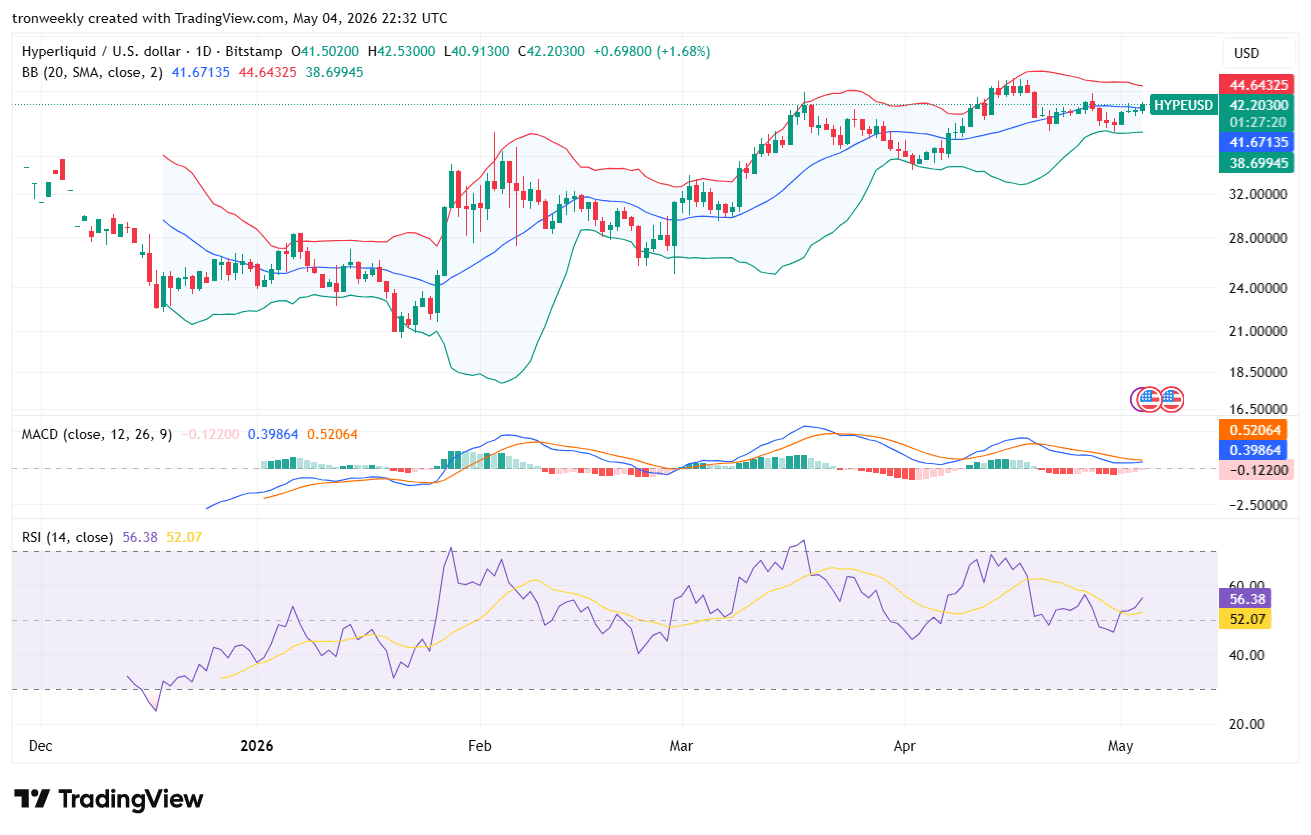

Source: Tradingview
The momentum indicators appear to have weakened compared to earlier times. The MACD is moving sideways, while the histogram is getting thinner, implying weakening buying pressure.
This article contains market analysis and price predictions. These are not guarantees. Crypto markets are volatile. Always DYOR. Not financial advice.
Also Read: Ethereum (ETH) Whale Accumulation Sparks Hope For a Move to $8,500

Be the first to comment