


What to know:
- Dogecoin nears key resistance at $0.1172 as buying pressure builds and momentum strengthens.
- Analyst confirms bullish channel structure with higher lows supporting the uptrend.
- RSI signals overbought conditions, while MACD and moving averages maintain a bullish outlook.

Dogecoin (DOGE) displays increased potential for upward action amid rising buying pressure. As it approaches an important level of resistance, investors will be waiting to see how far the price will continue its rise in the coming days.
At the time of writing, Dogecoin is trading at $0.1104, with a 24-hour trading volume of $3.57 billion and a market capitalization of $18.84 billion, according to CoinMarketCap. The price has gained 1.58% over the last 24 hours, reflecting steady upward momentum amid broader market stability led by assets like Bitcoin and Ethereum.

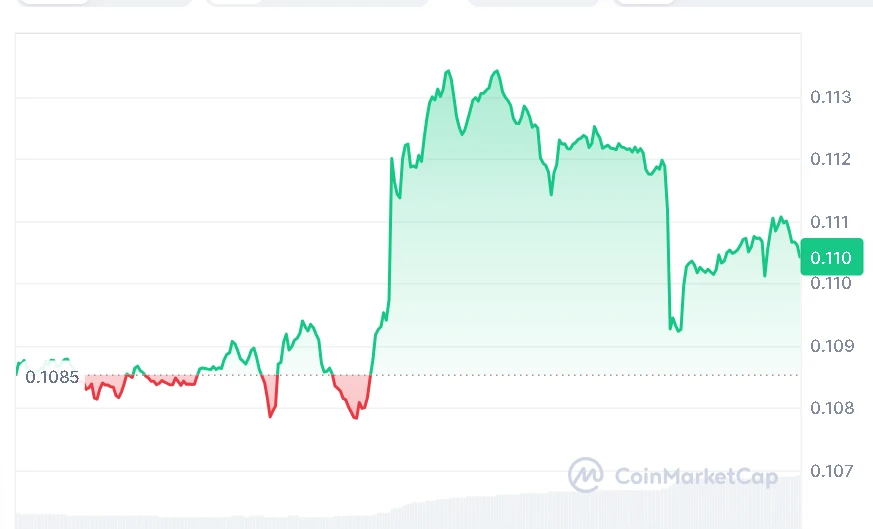
Source: CoinMarketCap

Also Read |Hyperliquid HIP-4 Event Contract Hits 6.05 Million Volume on Launch Day
Dogecoin Forms Bullish Channel Structure
Crypto Analyst Ali Martinez stated on May 4, 2026, that the price of Dogecoin is moving upwards within the boundaries of a price channel. His analysis revealed that the price channel pattern is still intact as DOGE forms higher lows, which generally indicates that the buyers are in control.

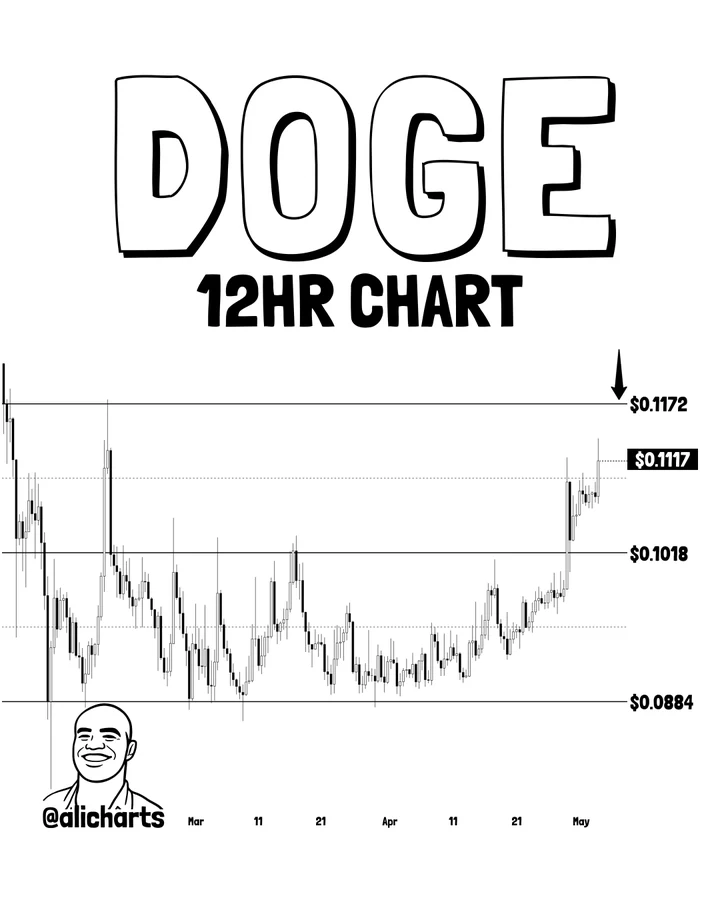
Source: Ali Martinez’s X Post
The next major target he pinpointed was $0.1172, which corresponded to the upper edge of the channel. A clear breakout above this target would pave the way for further growth, while an inability to breakout would result in a period of consolidation.
Dogecoin Momentum Faces Resistance Risk
From technical analysis, it can be observed that Dogecoin is gaining momentum, although there are certain signs that suggest there may be resistance soon. The RSI value is 76.07, which suggests a good buying power, but it is overbought.
Dogecoin is trading above its moving average ribbon, supporting the existing uptrend. 20-, 50-, and 100-day moving averages are all trading under the present value, thereby maintaining the bullish setup. The 200-day moving average near $0.12475 might serve as solid resistance in case the uptrend sustains.
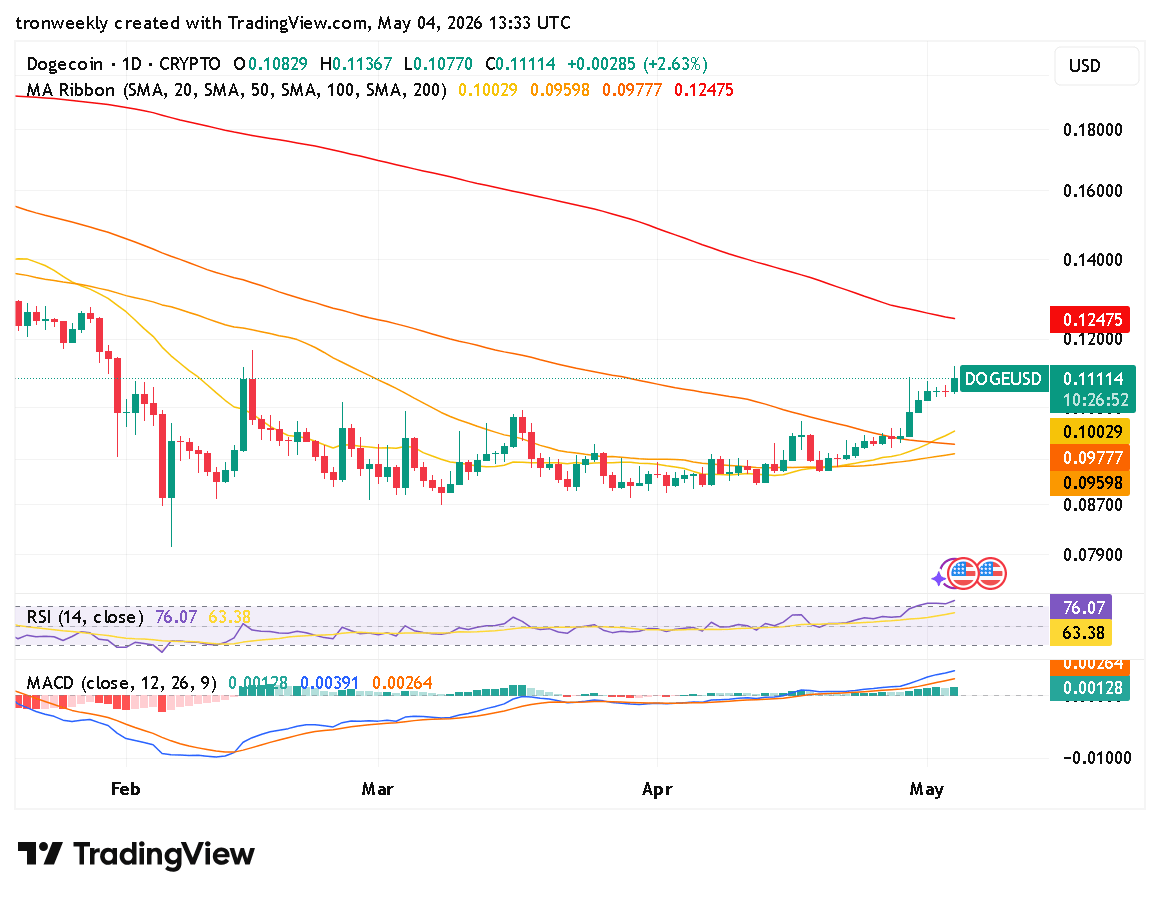

Source: TradingView
The Moving Average Convergence Divergence (MACD) indicator further confirms an optimistic scenario. This is because the MACD line is above the signal line while the histogram is in the positive zone, showing increasing bullish strength in the short-term.
Dogecoin continues to make consistent gains and demonstrates strong technical fundamentals. Nevertheless, the most critical test will be at the next support level, where there may be stronger selling pressure should the pace of gains slow down.
This article contains market analysis and price predictions. These are not guarantees. Crypto markets are volatile. Always DYOR. Not financial advice.
Also Read | Strategy Pauses Bitcoin Buys Ahead of Q1 Earnings Report
Be the first to comment