


What to know:
- ETH price trades at $2,371 as volume rises 17.18% to $20.86B, showing activity now.
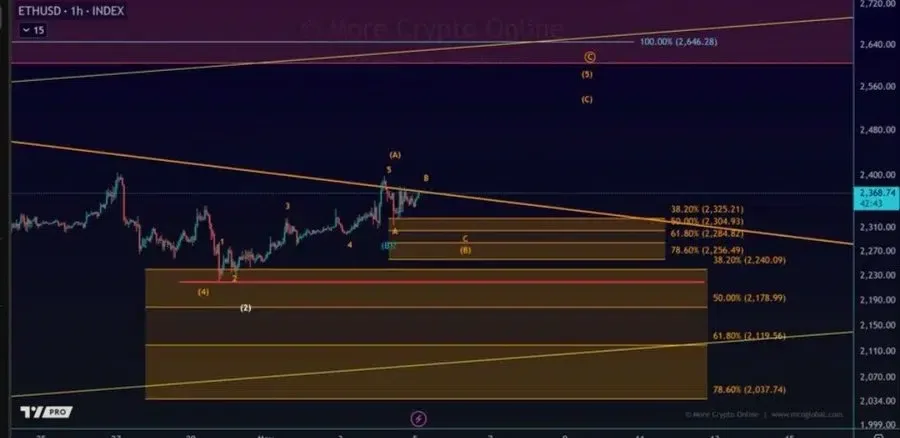
- Analysts watch $2,100-$2,200 demand support as ETH eyes the $2,500 target soon.
- BB and EMA data show ETH near resistance, while liquidations signal mixed pressure.

Ethereum (ETH) price remained resilient on May 5, 2026, as bulls attempted to extend the recent uptrend. ETH remained focused on immediate resistance levels amid expectations that support regions may hold up the ongoing recovery.
At the time of writing, the ETH price is trading at $2,371, and it is gaining at 0.45% in the last 24 hours. Its weekly gain stood at 3.68%, according to CoinMarketCap. The trading volume increased 17.18% to $20.86 billion, demonstrating stronger market activity.
Also Read: Ethereum Faces $2,400 Resistance as Momentum Weakens, Next Stop $2,700–$3,000

ETH Price Holds Demand Zone
Analyst Crypto Candy highlighted that ETH is moving in line with expectations. The asset found support in the $2,100–$2,200 demand zone. The price is now attempting to move higher.
The next target is near $2,500. A further move could extend toward $2,600–$2,700. This perspective is still valid if the price is above the demand zone.


Moreover, another analyst, CryptoGuru, pointed to weaker clarity in Ethereum’s microstructure compared to Bitcoin. This means that there is uncertainty in the short term, particularly when the price action is yet to be determined. Nevertheless, the larger trend still provides the possibility of an upside if buyers continue to defend key support levels.
The structure will be intact in the event that the ETH price is supported in the range of $2,256 to $2,325. This range is a significant directional value in the near future. A maintained position above this zone might reinforce another step towards greater levels of resistance. A breakdown below it may weaken the current recovery setup.

EMA Support Intact While BB Reflects Rising Volatility
From a technical perspective, ETH is trading above major short-term moving averages. The 20-day EMA is at $2,305.0. The 50-day EMA stands at $2,259.9. Any price movement beyond these levels indicates short-term strength. The 100-day EMA stands at $2,345.2, which is nearly the current trading level.
The long-term trend indicates resistance in the future. The 200-day EMA is at $2,600.4. This level coincides with the following upside target zone. A shift towards this range could validate a more powerful movement. The inability to go beyond short-term EMAs may undermine the existing trend.
Bollinger Bands (BB) indicate moderate volatility. The upper band is at $2,407.5. The middle band is at $2,324.7. The lower band stands at $2,241.9. The price moves within the upper range, which is an indication of momentum, but not the breakout.
Volume Rises as Open Interest Edges Higher
CoinGlass derivatives data show increased activity. The future volume increased 21.62% to $52.53 billion. Open interest rose 0.24% to $33.56 billion. The OI-weighted funding rate is at -0.0036%. This reflects cautious sentiment among traders.
The liquidation data indicate that the positioning is mixed. In 24 hours, total liquidations reached $74.38 million. Long liquidations were at $33.64 million. The short liquidations stood at $40.73 million. This points to the pressure on both sides of the market.
Also Read: ONDO Finance (ONDO) Rally Gains Momentum: Can Price Hit $0.80 Next?
Be the first to comment