

I have found over the years, that one sure way to get one’s head chopped off is to stick one’s neck out too early on a given technical thesis, but often the prevailing technical features are compelling enough to take that potentially ill-fated chance. The following presents a case that Bitcoin is on the cusp of a follow-through rally to higher prices and that it can easily rally through resistance at the Kijun Plot (green line) and return to the confines of the longer-term Schiff Modified Pitchfork (red P1 through P3). I’ll first start with the weekly charts…
The weekly Bitcoin price has broken out above the confluence of price resistance at the P3 price pivot low and the January 30th intra-week low at 80,595.20. The panel directly below the price chart is my version of Relative Strength Index which, like RSI, measures the magnitude of recent price changes to evaluate overbought or oversold conditions in an asset and below that is the Custom Oscillator which is an unbound momentum indicator. Note that in November of last year the MC Oscillator made a low and a second low in late February of this year (light blue horizontal dashed lines) but the Custom Oscillator did not and produced a long-term non-confirmation of the late February price lows.
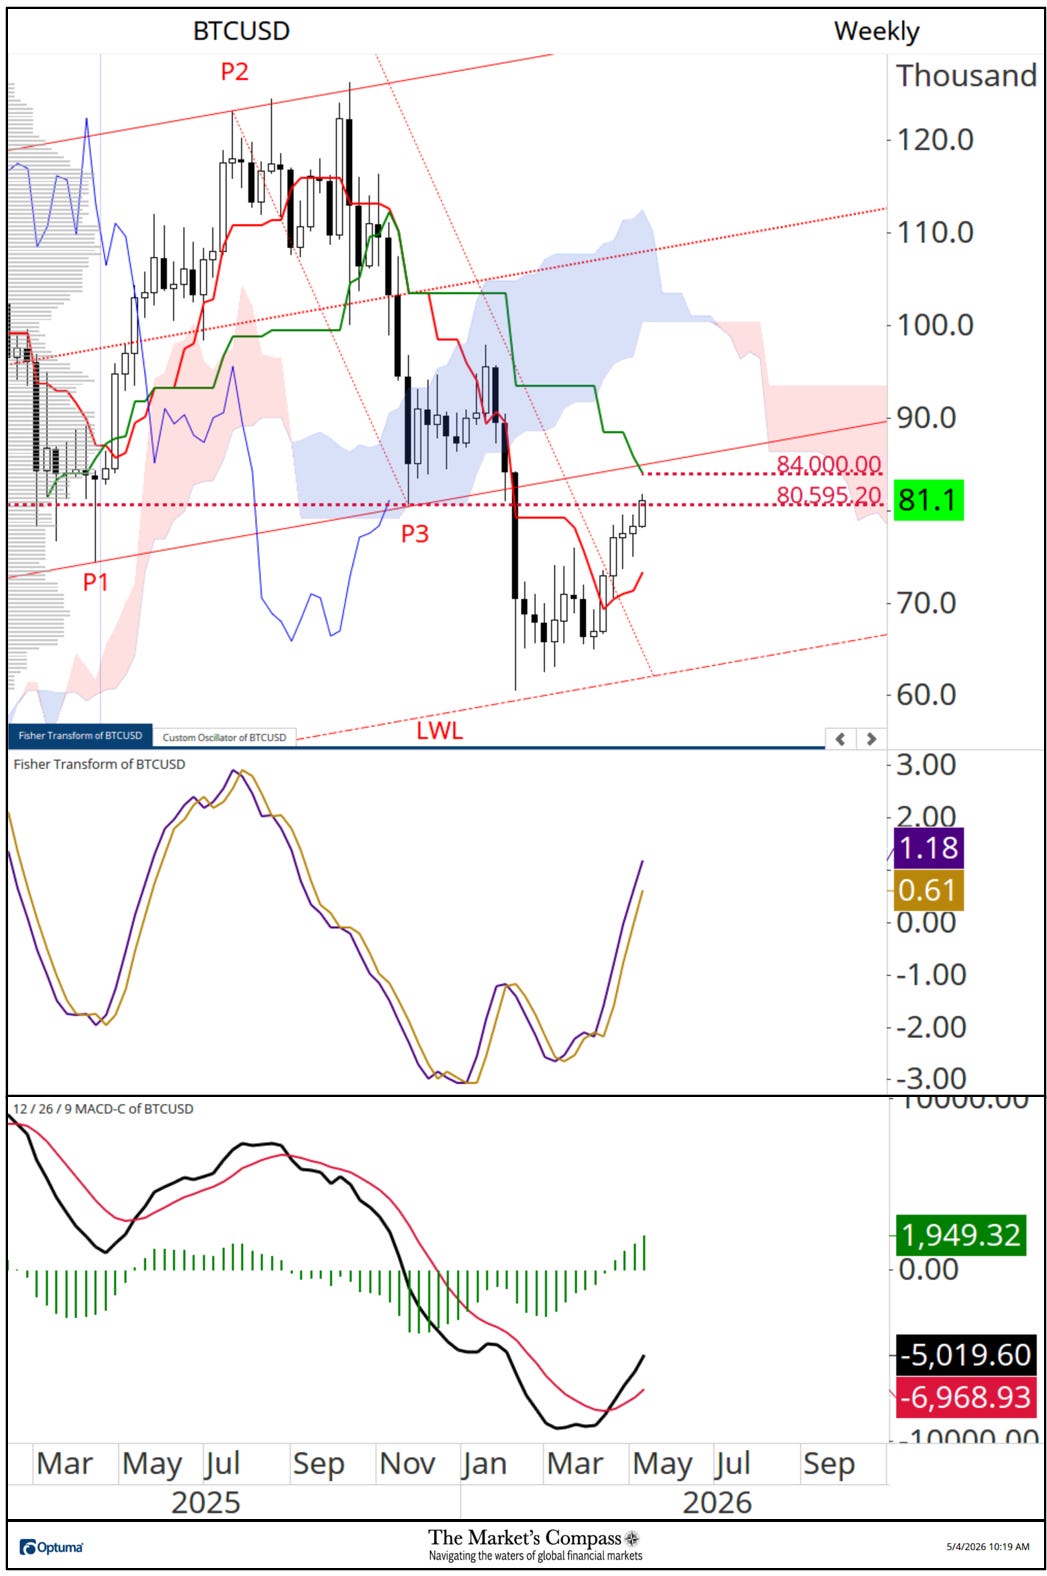
This second weekly chart adds two different oscillators to the same price chart. The panel below the price panel is the Fisher Transform which is an oscillator based on complex mathematical theories (such as probability density functions) and transforms prices into sine wave that seeks to pinpoint extremes in the market. The tool is made up of a pair of lines moving above and below the central value of zero. One line is the current Fisher Transform value and the other, the trigger line. In early April, The Fisher Transform tested support at the trigger line and has moved sharply higher and is back above the value of zero. The bottom panel contains MACD which is a momentum indicator which should need no definition. It has turned up through its signal line from oversold territory.
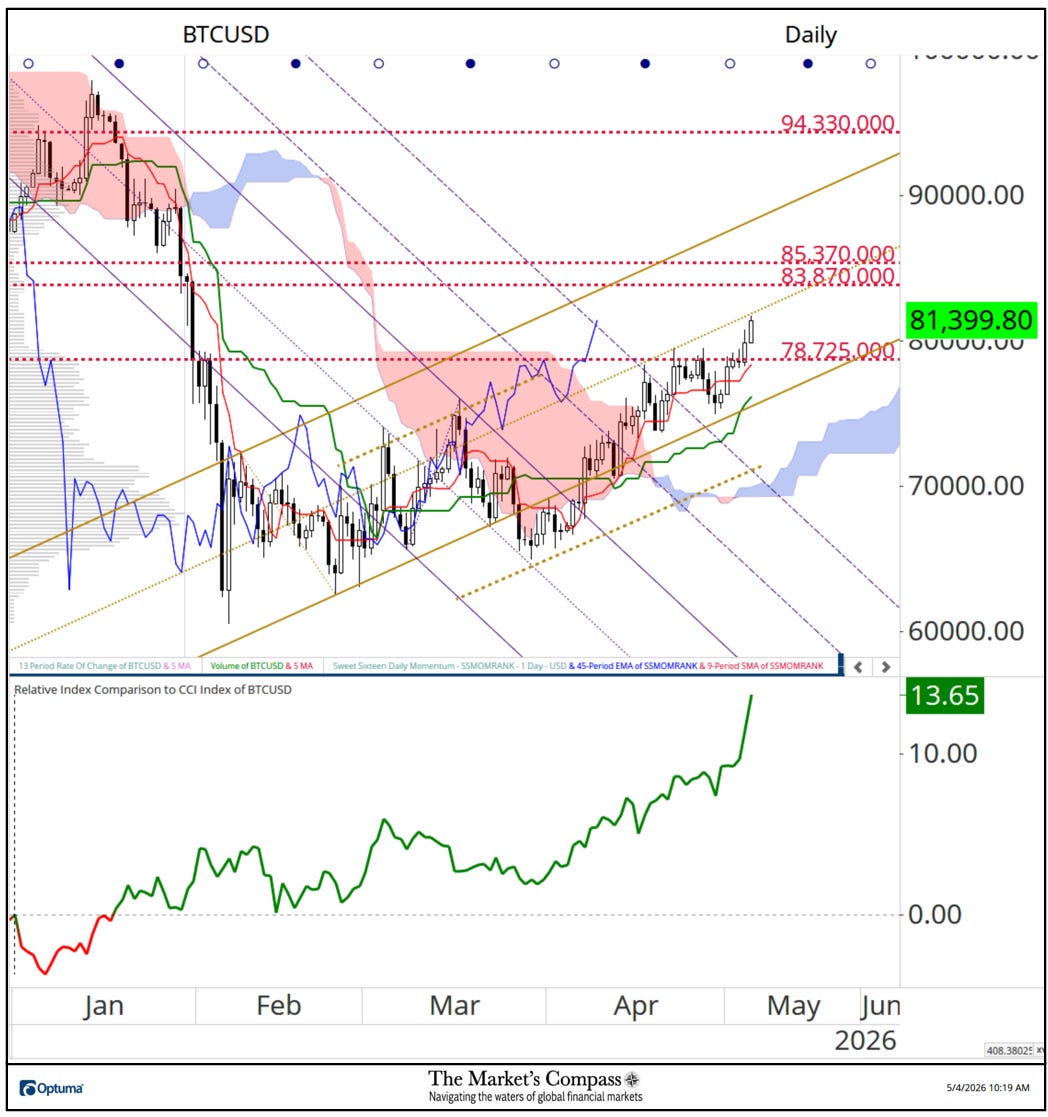
The Daily Bitcoin chart shows the bona fide breakout above price resistance on Sunday, and today’s follow-through to just under the Median Line (gold dotted line) of the Schiff Modified Pitchfork. The Lagging Line, which is the current price (close) shifted back 26 bars (blue line), held support at the Median Line twice and moved out of the Cloud in early April signaling the upcoming trend change. The panel below the price chart is a line chart of the Relative Index Comparison of Bitcoin vs. the broader CCi30 Index*. Aside from a brief spell of weakness in the first half of January Bitcoin has since outperformed the broader index by 13.65%.

Will my head be “chopped off” and is this a false breakout? The current technical evidence suggests no. Only a drop back below 78,725.00 and a pullback that falls back below the lower parallel and Kijun Plot (green line) would suggest that this technical thesis is overly bullish.
*The CCi30 Index is a registered trademark and was created and is maintained by an independent team of mathematicians, quants and fund managers lead by Igor Rivin. It is a rules-based index designed to objectively measure the overall growth, daily and long-term movement of the blockchain sector. It does so by indexing the 30 largest cryptocurrencies by market capitalization, excluding stable coins (more details can be found at CCi30.com).
For readers who are unfamiliar with the technical terms or tools referred to in the comments on the technical condition of the CCi30 Index can avail themselves of a brief tutorial titled, Tools of Technical Analysis available on my website.
Charts are courtesy of Optuma whose charting software allows the Technical Rankings to be calculated and back tested.
To receive a 30-day trial of Optuma charting software go to…

Be the first to comment