


What to know:
- XTZ’s falling wedge suggests weakening bearish momentum, with breakout targets between $0.60 and $7.60 if confirmed.
- MACD shows a bullish crossover, hinting at improving momentum despite low overall strength.
- RSI near 53 indicates neutral-to-bullish conditions, with buyers stepping in before oversold levels.

Tezos (XTZ) is moving in a positive price trajectory, with the reversal in sight as the token records a bounce from the lower boundary of a falling wedge. According to CoinMarketCap, XTZ is currently trading at $0.3722, with a 24-hour gain of 1.95%. Despite this positive movement, XTZ’s open interest and volume are declining, which points to a cautious sentiment ahead.

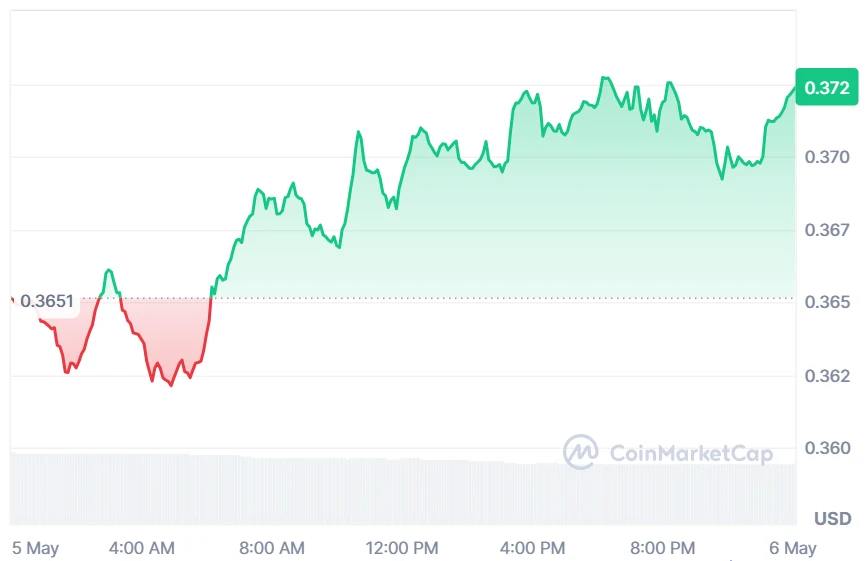
Source: CoinMarketCap
XTZ Derivative Data Point to Cautious Optimism
According to Coinglass, the XTZ open interest decreased by 2.13%, reaching $14.94 million, indicating a slight reduction in outstanding derivative contracts and suggesting a mild decline in trader participation and positioning across the market, reflecting cautious sentiment among participants.

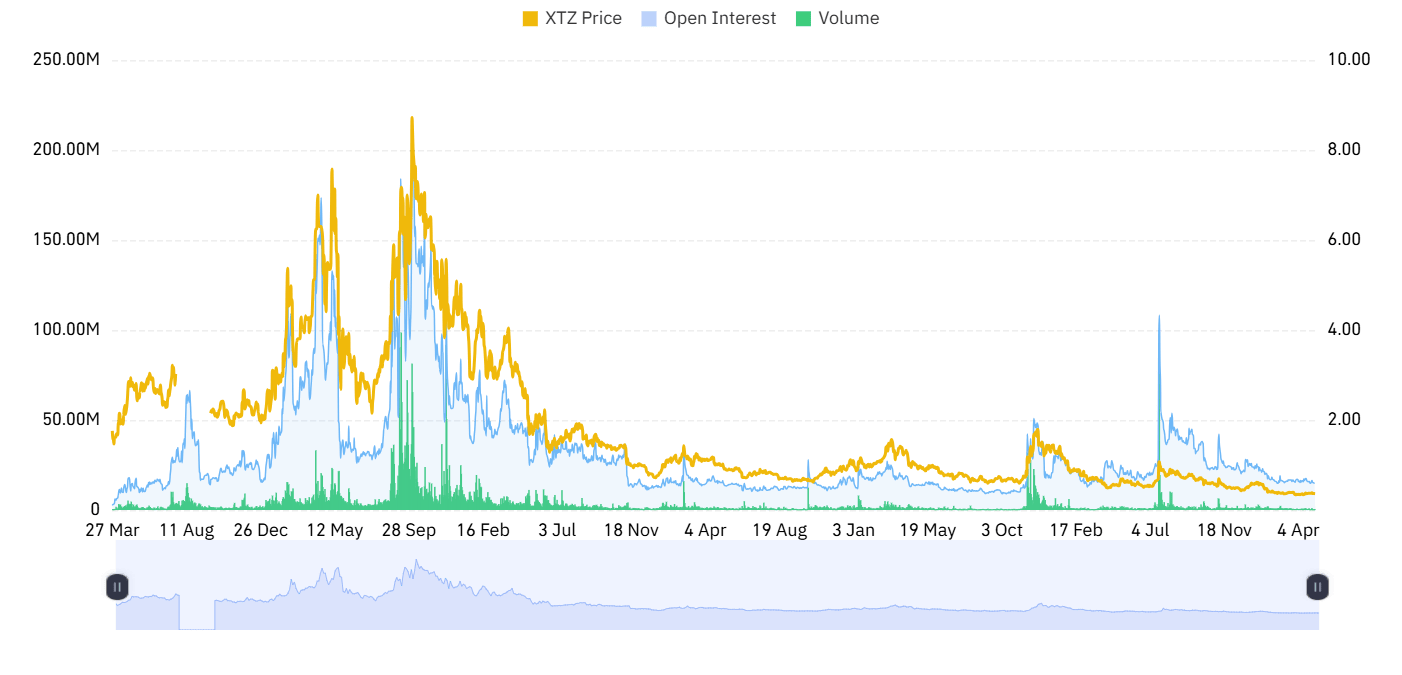

Source: Coinglass
Furthermore, volume decreased by 32.58%, reaching $12.02 million, signaling reduced trading activity and weaker short-term liquidity conditions in the market, which may indicate lower participation levels and a slowdown in overall transaction flow.
Also Read: Tezos (XTZ) Poised For Huge Uptick: Analyst Predicts Surge to $3.95
XTZ Falling Wedge Signals Potential Reversal
Furthermore, the crypto analyst Jonathan Carter highlighted that XTZ is currently testing a crucial technical zone as it trades near the lower boundary of a falling wedge pattern on the 2-week chart.
This structure typically signals weakening bearish momentum and potential reversal conditions, as sellers lose strength and buyers begin to gradually absorb supply at key support levels.
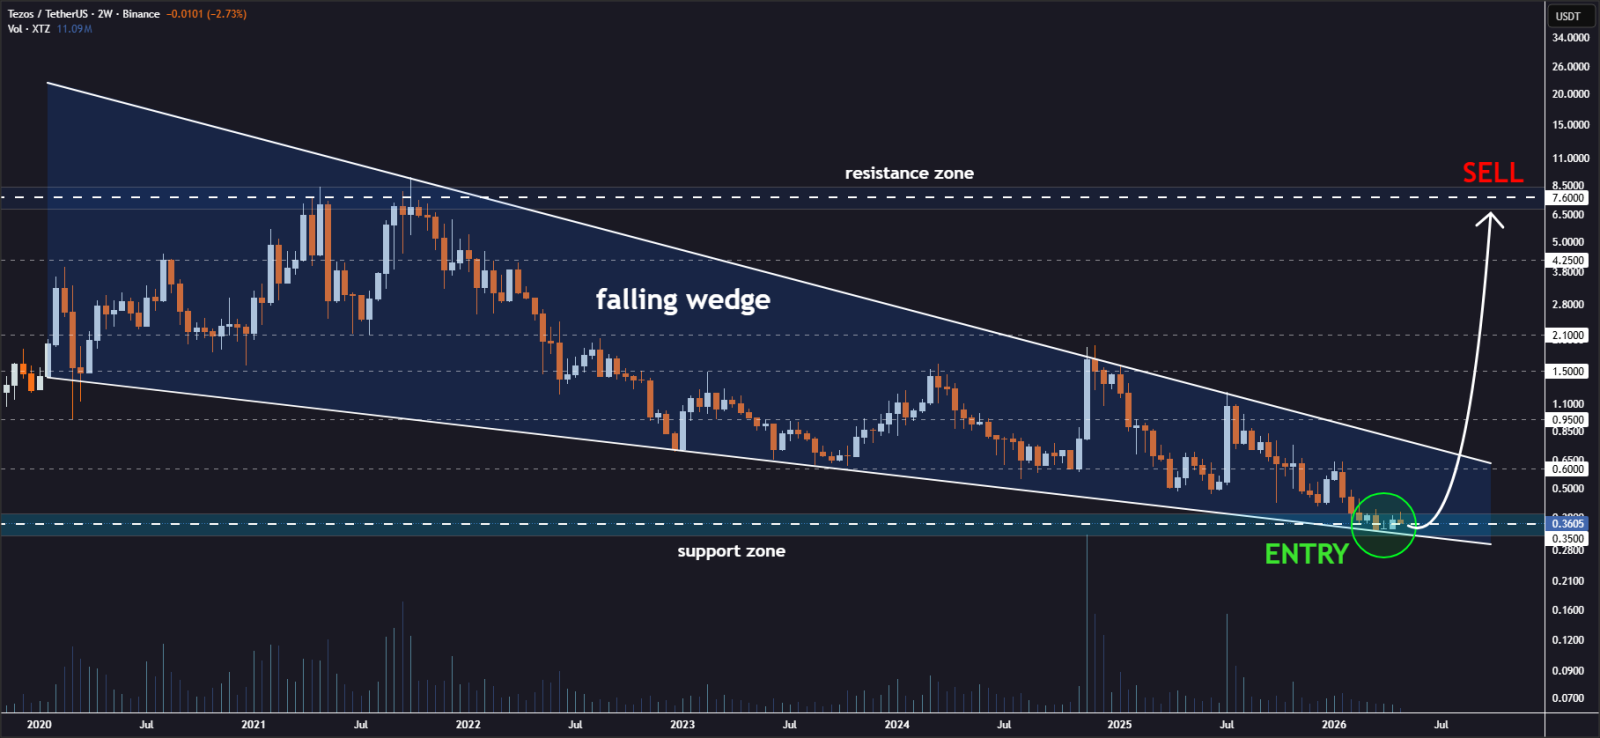

Source: Jonathan Carter’s X Post
In case the upward momentum builds up and a breakout is confirmed in the price action, then XTZ might initiate an uptrend move that may have possible targets anywhere between $0.60 and $7.60.
However, falling below the current support zone might result in the invalidation of the trading idea, with the overall trend remaining bearish.
Momentum Indicators Point to Improving Outlook
According to TradingView, the MACD indicator provides a new bullish crossover pattern with the blue line crossing over the signal line.
The green bar suggests that there may be a shift to positive momentum but at levels much lower than the peak achieved in mid-May. In essence, it points to a cautious recovery phase from a consolidation period.
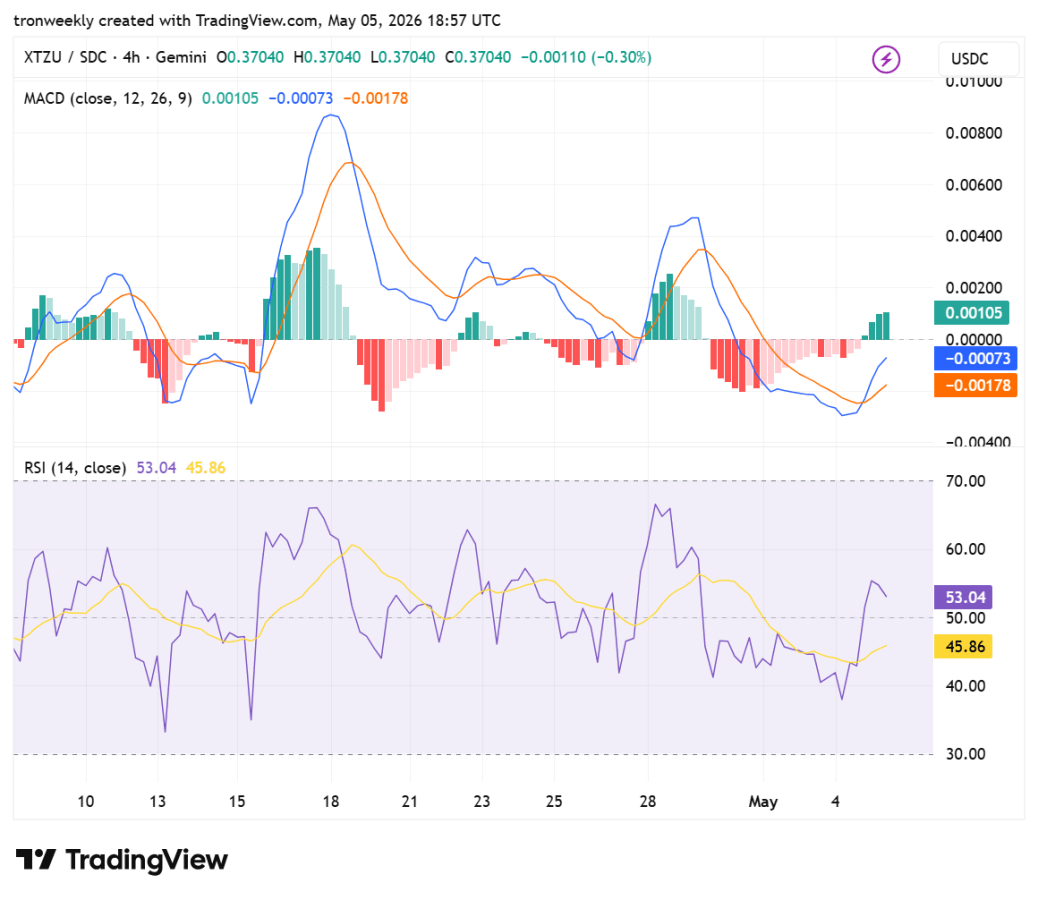
Source: TradingView
The RSI is at 53.04, indicating a positive attitude with a slight bias towards being bullish. As the asset recovered from the 40-point level, buyers were buying the asset to prevent it from becoming oversold.
This neutrality reflects that the token needs another strong trigger to make it go either upwards or downwards.
This article contains market analysis and price predictions. These are not guarantees. Crypto markets are volatile. Always DYOR. Not financial advice.
Also Read: Top 5 Budget-Friendly Cryptos: Jupiter (JUP), Tezos (XTZ), PNUT, and More Primed for a Bullish Run

Be the first to comment