


What to know:
- Chainlink (LINK) consolidates bullishly above support, signaling potential upward momentum.
- Derivatives activity rises, with open interest up 4.48% to $440.99M, reflecting trader confidence.
- Technical indicators improve, with RSI at 66.19 and price reclaiming the 100-day EMA.

Chainlink (LINK) is moving in an upward consolidation phase with a reversal in sight as the token holds above the lower boundary of the symmetrical triangle. However, the LINK breakout is also supported by rising open interest and volume. According to CoinMarketCap, as of Wednesday, May 6, LINK is currently trading at $9.96, with a 24-hour gain of 2.73%.

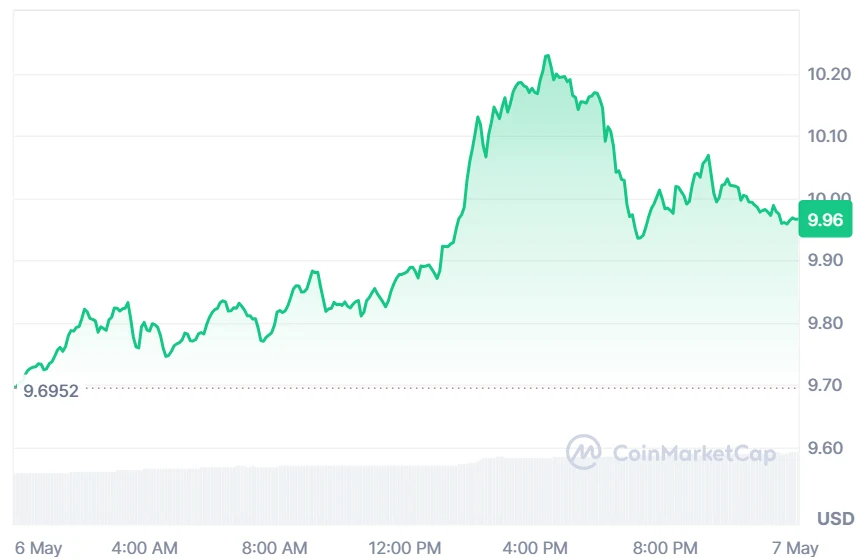
Source: CoinMarketCap
Derivative Data Support LINK Breakout Potential
According to Coinglass, the LINK open interest rose by 4.48%, reaching $440.99 million, indicating increasing engagement in derivatives positions, with traders expanding exposure and confidence improving across market participants, suggesting stronger positioning activity and potential continuation of current market trends.


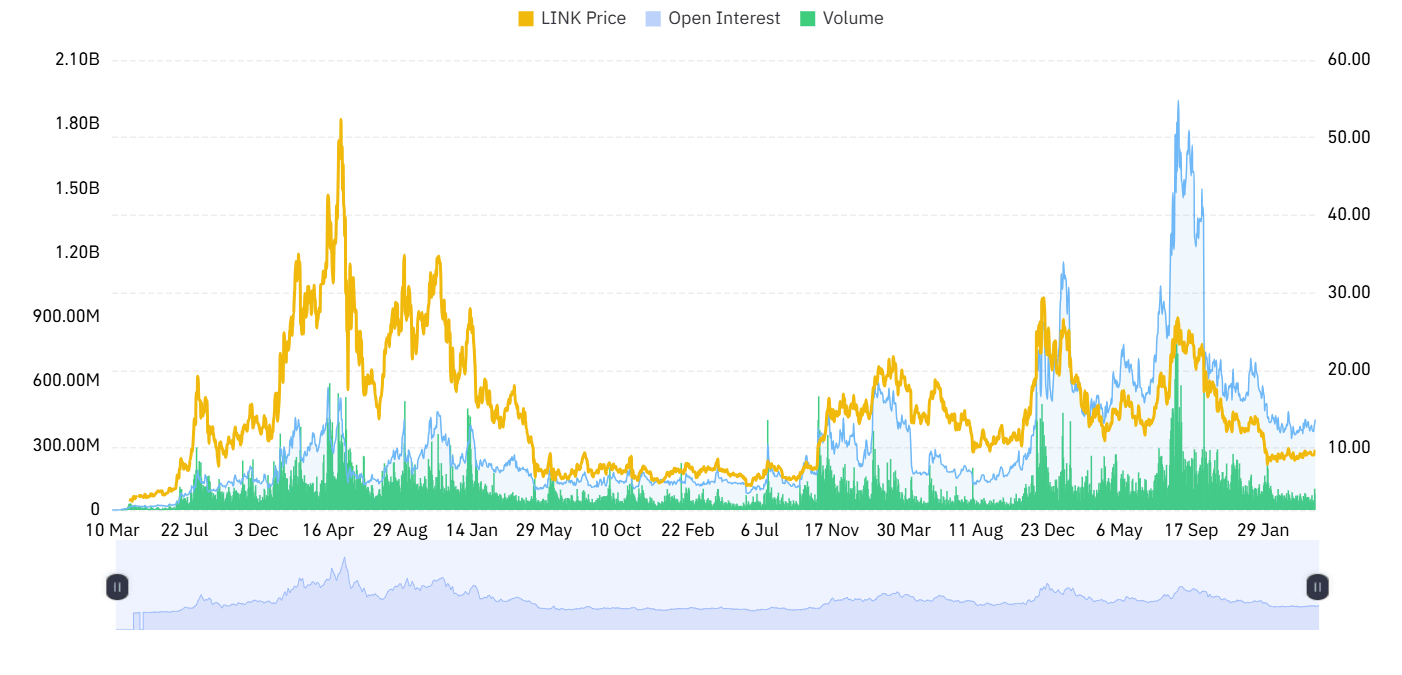
Source: Coinglass
However, the volume increased by 33.82%, reaching $778.87 million, showing strong trading activity and improved liquidity boosting LINK Breakout, driven by heightened investor participation, market momentum, and increased speculative interest across the asset, reflecting robust demand conditions and active market engagement during the period of overall growth.
Also Read: LINK Price Analysis: $9 Support Holds as $10 Breakout Signals Next Rally
LINK Consolidation Signals Potential Bullish Breakout
Furthermore, the crypto analyst Jonathan Carter highlighted that LINK is consolidating within a symmetrical triangle on the weekly chart, currently testing its lower support trendline.
This structure reflects market indecision, with price compressing between higher lows and lower highs. Holding this level suggests buyers remain active, and momentum indicators hint at a potential bullish continuation if support continues to hold.
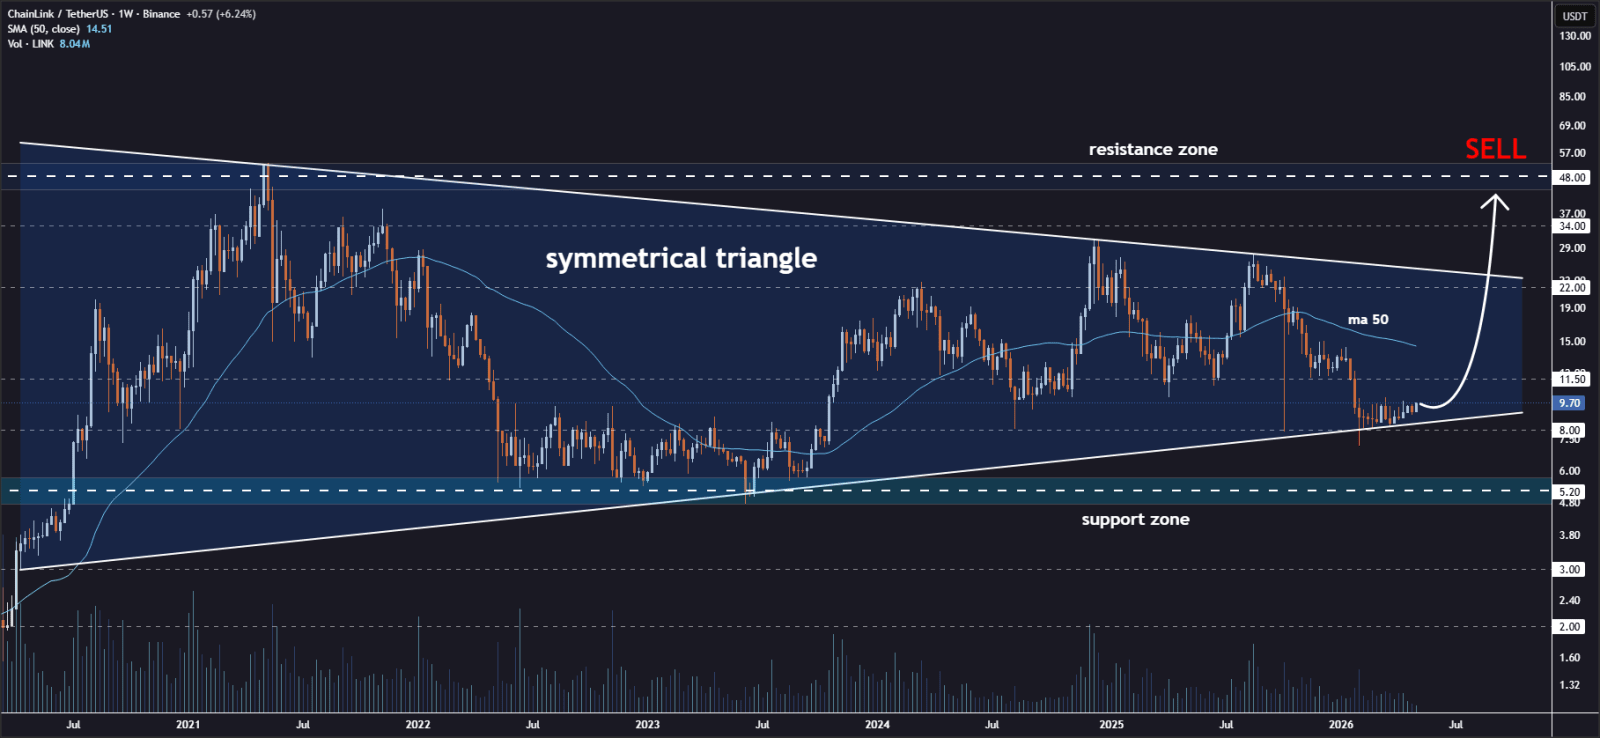
Source: Jonathan Carter’s X Post
If LINK breakout holds strong, the target prices are set to be at $11.50, $22.00, $34.00, and $48.00. The breakout will signal rising volatility with the prospect of moving further upward, but if LINK breaks down below support levels, a bearish outlook would follow with an emphasis on lower retracement targets.
LINK Technical Indicators Support Bullish Reversal
According to TradingView, the LINK breakout illustrates the transition from a sudden drop to consolidation.
Price was able to find a footing following its drop to $7.40 and recently has made a strong move upwards, breaking above the $9.83. The upside break indicates that buyers are now taking control again after several months of selling pressure.
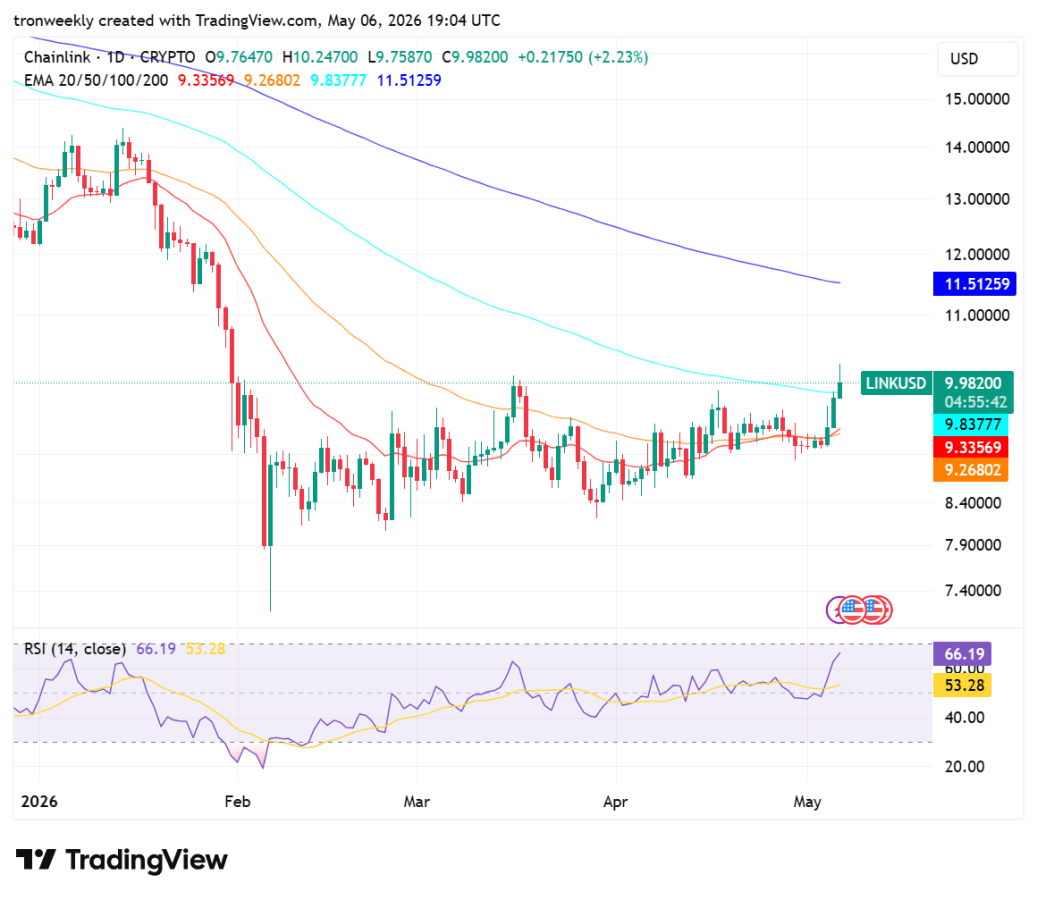
Source: TradingView
The technical indicators also favor the LINK breakout, with the RSI climbing to 66.19, indicating intense bullishness. Although there is an uptrend forming, it should be noted that the 200-day EMA of $11.51 still stands as a significant barrier for prices.
LINK has to maintain above the $10.00 psychological point in order to challenge the prevailing downtrend formed back in 2026.
This article contains market analysis and price predictions. These are not guarantees. Crypto markets are volatile. Always DYOR. Not financial advice.
Also Read: Chainlink Whale Moves $25M Between Exchanges Over 3 Weeks

Be the first to comment