


What to know:
- BNB price analysis shows key resistance as the token trades near the $641 zone.
- Higher lows and rising volume keep the bullish breakout setup active for BNB.
- EMA and BB data show short-term support, with resistance still overhead.

Binance Coin (BNB) price analysis reveals that the price of the token is heading towards a significant technical zone following the formation of higher lows over the past few weeks, on Thursday, May 7. BNB has now entered a significant resistance area, and the upcoming price movement may be influenced by its reaction to this area.
As of press time, Binance Coin (BNB) is trading at $641, representing a decline of 1.29% in the past 24 hours. According to CoinMarketCap data, the token has gained 3.96% over the last seven days. The trading volume is down by 34.54% and is now standing at $1.66 billion.
Also Read: Solana Price Analysis: SOL Eyes $120 After Multi-Month Resistance Break

BNB Tests Key Trendline Resistance
A well-known analyst, Cryptorphic, highlighted that BNB is currently approaching a descending trendline as well as the 200-day moving average. This area is a significant resistance area that has been rejected in the past.
BNB recently rebounded strongly from support, but the current resistance zone now presents a major test. A clear breakout may signal a momentum change. However, another rejection could lead to a new pullback.

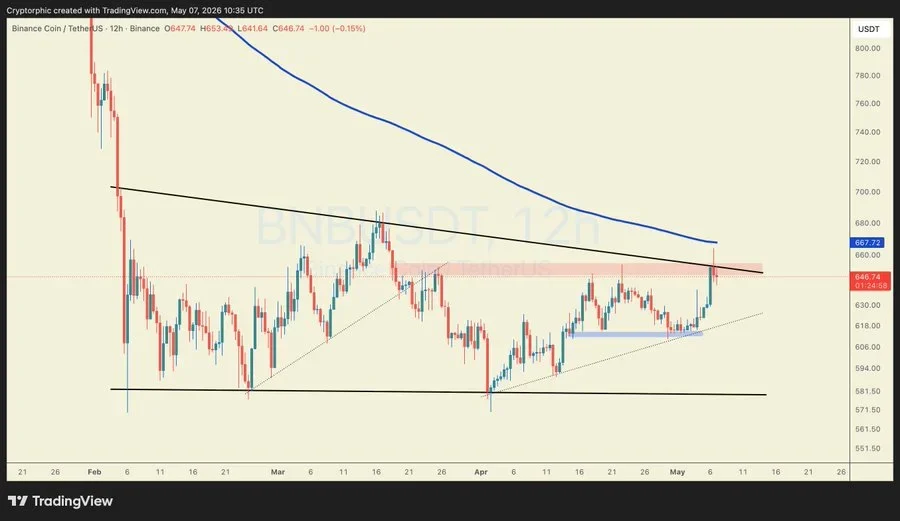
The latest BNB price analysis shows short-term strength as the token trades near $641.04. The session moved between $653.49 and $640.44, showing active price movement near resistance.
Furthermore, another analyst, CryptoGuru12, mentioned that the breakout continuation setup remains active. The chart indicates a consistent trend of rising highs and rising lows. Increased volume also indicates increased buyer activity in the move.
The analyst flagged the price range of $638-$642 as a possible accumulation area. The subsequent targets on the upside are $650 and $658, with short-term support close to $635. This scenario leaves BNB poised for a breakout attempt.
BNB Price Analysis Eyes Major EMA Barriers
According to TradingView data, the 20-day EMA is at $626.96, while the 50-day EMA stands at $631.01. BNB is still trading above both levels; this is bullish for the short-term trend. Buyers have also supported dips back toward these averages, leaving higher lows intact.
Longer-term EMA data shows the 100-day EMA at $667.37 and the 200-day EMA at $725.56. Both levels are above the current price. This is a significant resistance level if BNB continues its recovery.
According to Bollinger Band (BB) data, the middle band appears at $628.00, the upper band is $646.68, and the lower band is $609.32. BNB is trading near the upper band. This signals upward pressure, but it also places price near a possible reaction zone.
This article contains market analysis and price predictions. These are not guarantees. Crypto markets are volatile. Always DYOR. Not financial advice.
Also Read: ICP Price Analysis Targets $2.95 as Bullish Structure Forms

Be the first to comment