


What to know:
- Litecoin price is hovering near key resistance around $57, showing signs of slowing bullish momentum.
- On-chain data shows steady long-term accumulation despite low social engagement, signaling hidden investor confidence.
- Technical indicators (RSI and MACD) suggest weakening momentum, pointing toward possible short-term consolidation.

Litecoin (LTC) price is seeing waning energy amid its accumulation by long-term investors despite low social engagement. Having made a run following a bullish impulse, LTC is set to consolidate before its next big move.
At the time of writing, LTC is trading at $57.29, down 2.04% over the last 24 hours. The cryptocurrency recorded a daily trading volume of $377 million, while its market capitalization remained close to $4.42 billion, according to CoinMarketCap.
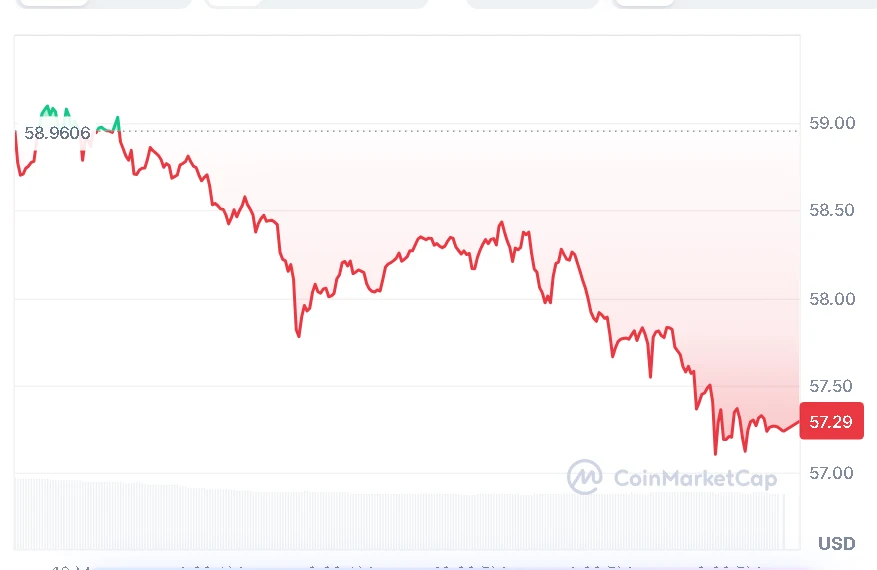

Source: CoinMarketCap

Also Read | Hyperliquid ETF Filing by Grayscale Adds Staking Feature for HYPE Investors
LTC Price Quietly Builds Momentum
Recently, data shared by crypto analytics firm Alphractal indicated that there was a significant change in the behavior of the Litecoin price. As reported on May 12, despite a decrease in conversations about the coin and reduced social interaction, LTC holders were able to increase their stake in the currency in April.


Source: Alpharactal’s X Post
According to the analytics firm, long-term holdings of supplies were growing steadily throughout the month, indicating that investor confidence remained strong despite low market focus on the asset. This type of behavior is generally considered indicative of a silent building phase.
Litecoin Price Momentum Begins Cooling Near Resistance
The Litecoin price was last seen rising, but it appears that it has started to slow down due to resistance near the $57 mark. The technical analysis indicates that the buyers currently have an edge, albeit a weakening one.
The current RSI stands at 53.44, while its moving average is at 56.04. The RSI being above the 50 mark suggests a preference for buyers in the current trading range.
However, the RSI is showing considerable weakness since it is below the highs recently experienced, meaning that investors are now locking in their gains following the bullishness shown by Litecoin.


Source: TradingView
Meanwhile, the MACD is still indicating positive momentum for the currency pair. The MACD line has been holding steady at 0.81852 against the signal line at 0.58480, while the histogram is trading at 0.23372.
Despite all that, the decreasing distance between the MACD and signal lines indicates that upward momentum is losing steam. Should the downward pressure on sales continue to increase, the Litecoin price might consolidate for a while prior to breaking out.
Currently, the Litecoin price is still fairly well-balanced, thanks to the persistent accumulation that continues to occur despite the declining short-term momentum.
This article contains market analysis and price predictions. These are not guarantees. Crypto markets are volatile. Always DYOR. Not financial advice.
Also Read | CAKE Price Prediction: Bullish Structure Points to a Rally Toward $1.80 Target

Be the first to comment