


What to know:
- BNB consolidates near $658 as traders watch resistance levels, with improving momentum and breakout signals forming.
- Technical indicators show neutral-to-bullish momentum as RSI recovers to 51.20, moving out of oversold conditions.
- Analysts highlight a bullish setup for BNB, with targets from a $738 breakout to a long-term $1,376 projection.

Binance Coin (BNB) is consolidating after a prior peak, with price stabilizing but still facing strong resistance levels. However, technicals show improving momentum and recovery for BNB price from oversold conditions. Derivatives data further reflects rising open interest and volume, signaling stronger market engagement. According to CoinMarketCap, BNB is trading at $658.55 with a weekly gain of 4.64%.

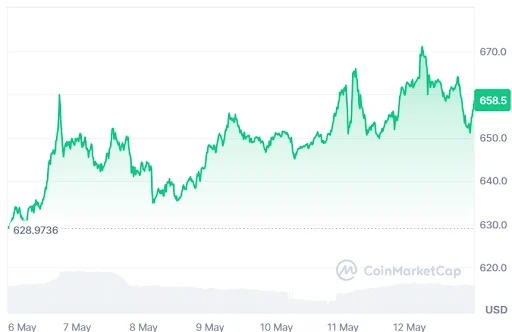
Source: CoinMarketCap
BNB Derivative Data Point to Improving Sentiment
According to Coinglass, the BNB open interest rose by 3.13%, reaching $1.04 billion, indicating increased capital commitment in derivatives markets. This suggests growing trader participation and stronger positioning, reflecting confidence in ongoing trends and potential continuation of market activity in the near term.


Source: Coinglass
Trading volume increased by 13.44 percent, reaching 1.05 billion dollars, showing stronger market activity and liquidity. This rise reflects heightened investor engagement and more active participation, suggesting improved momentum and broader interest across the market during the current period now.
Also Read: BNB Price Breakout Targets $670 Amid $3.5B Treasury Growth
BNB Price Action Points to a Rally Toward $1,376
Furthermore, the crypto analyst Javon Marks highlighted that BNB has gained attention from the experts who have found an inconspicuous bullish divergence in BNB price action.
This occurs when the price creates higher lows despite the weakening of momentum oscillators. The interpretation of this chart pattern is that the underlying bullish strength may be capable of supporting the existing uptrend.


Source: Javon Marks’ X Post
However, it is believed to be an indication of further strength to come for the BNB price, although some speculations point towards a target of around +103%, possibly hitting $1,376 and even above.
But these forecasts depend on several factors, including sustained strength and sentiment from the markets. Absent that, the formation is not a surefire indication of a breakout.
Technical Indicators Point to Fading Bearish Strength
According to TradingView, the BNB price on the 3-day chart reflects an overall change as the coin peaked at $1,300. In light of lower highs, a massive drop in February has brought the price range down to between $555 and $700.
The BNB price is now standing at $657.05, attempting to stabilize and get back above the 20-period exponential moving average.


Source: TradingView
Technical indicators reveal a potential move to neutral to bullish momentum. The RSI indicator has crossed into the positive zone at 51.20.
However, the BNB price is being pulled back by a strong band of resistance that comprises the 50, 100, and 200 EMA periods. A breakout above $738 will mark the end of the correction phase.
This article contains market analysis and price predictions. These are not guarantees. Crypto markets are volatile. Always DYOR. Not financial advice.
Also Read: BNB Price Outlook Eyes Breakout as $750 Target Comes Into Focus
Be the first to comment