


What to know:
- SUI price is in a short-term pullback, but the overall breakout structure remains intact.
- Key resistance targets remain $1.95, $2.40, $3.10, and $4.20 if bullish momentum returns.
- Momentum indicators stay positive as RSI nears overbought, and MACD remains bullish.

SUI price is undergoing a retracement from its breakout pattern in the short term, although the bigger picture market trend shows that the uptrend is still ongoing. Even as the pace of movement has slowed down, it appears that there is room for more gains if buyers can push prices higher again soon.
At the time of writing, the SUI is trading at $1.18, with a 24-hour trading volume of $1.02 billion and a market capitalization of $4.84 billion. Over the last 24 hours, the SUI price has declined by around 3.99%, reflecting a mild correction following its recent upward surge. This pullback appears more like a cooling phase rather than a trend reversal.
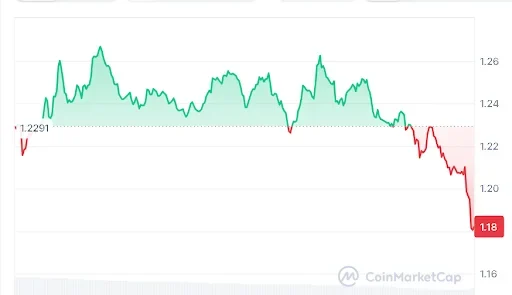

Source: CoinMarketCap

Also Read | APE Price Consolidation Signals a Potential Breakout Toward $1.90 Target
SUI Breakout Targets Higher Levels
On May 13, 2026, crypto analyst Jonathan Carter pointed out an important technical breakthrough in SUI’s chart formation. In his opinion, the coin managed to break above its declining channel pattern on the daily chart, along with increasing volume levels.

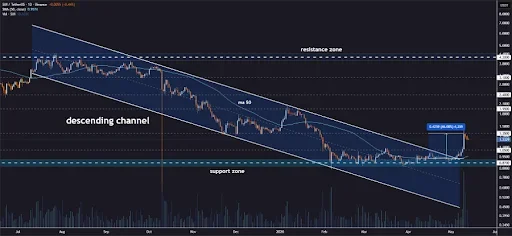
Source: Jonathan Carter’s X Post
However, he observed that this had resulted in a 46% profit already, which means good participation from the market for the rally. This will stay bullish as long as momentum supports the structure.
However, from the above analysis on the present SUI price levels, we can observe that the asset is still likely to continue moving further upwards if buyers are able to muster more power following the retreat.
The important resistance targets for upward movement are $1.95, $2.40, $3.10, and $4.20. The overall SUI price performance is still in line with the breakout pattern.
SUI Price Near Overbought Zone
Based on the momentum indicators, the SUI price looks positive. Currently, the RSI (14) is at 65.69, while its average is 60.37. This shows that there is still bullishness in the market, even though the pace is slowing down. The RSI almost got into overbought territory above 70.
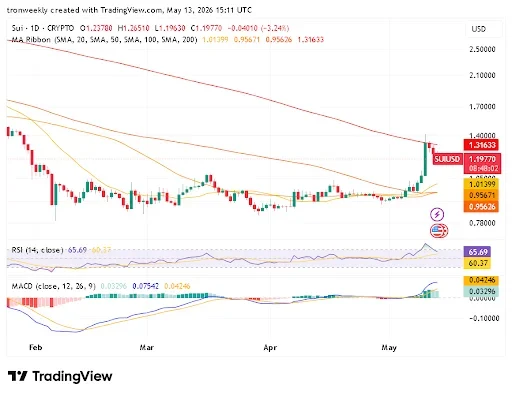

Source: TradingView
MACD is still favoring bulls, as the MACD line remains above the signal line with a MACD line value of 0.07542 and a signal line value of 0.04246. Positive values of the histogram affirm continued uptrend movement, but decreasing bars indicate deceleration in the buying trend.
SUI Price Trend Remains Strong
Overall, the technical strength of the SUI price is still intact since the breakout occurred. Although there seems to be some correction on a short-term basis, the overall trend pattern still stands. Provided that momentum holds steady, the SUI price could continue its move higher into higher resistance levels.
This article contains market analysis and price predictions. These are not guarantees. Crypto markets are volatile. Always DYOR. Not financial advice.
Also Read | AVAX Price Prediction: Drastic 1.56% Rally Ahead

Be the first to comment